| __timestamp | Elbit Systems Ltd. | Parker-Hannifin Corporation |
|---|---|---|
| Wednesday, January 1, 2014 | 358274000 | 1832903000 |
| Thursday, January 1, 2015 | 390932000 | 1861551000 |
| Friday, January 1, 2016 | 424003291 | 1558088000 |
| Sunday, January 1, 2017 | 438616108 | 1846306000 |
| Monday, January 1, 2018 | 374866620 | 2382235000 |
| Tuesday, January 1, 2019 | 502866000 | 2513468000 |
| Wednesday, January 1, 2020 | 484464000 | 2431500000 |
| Friday, January 1, 2021 | 576645646 | 3092383000 |
| Saturday, January 1, 2022 | 505269000 | 2441242000 |
| Sunday, January 1, 2023 | 544811000 | 4071687000 |
| Monday, January 1, 2024 | 5028229000 |
In pursuit of knowledge
In the ever-evolving landscape of industrial giants, Parker-Hannifin Corporation and Elbit Systems Ltd. have showcased intriguing financial trajectories over the past decade. From 2014 to 2023, Parker-Hannifin's EBITDA has surged by approximately 122%, peaking in 2023 with a remarkable 4.07 billion. This growth underscores its robust market position and strategic expansions. In contrast, Elbit Systems Ltd. has experienced a more modest increase of around 52% during the same period, reaching its highest EBITDA in 2021. Despite the slower growth, Elbit Systems has maintained a steady financial performance, reflecting its resilience in the defense sector. Notably, the data for 2024 is incomplete, leaving room for speculation on future trends. This comparison not only highlights the dynamic nature of these corporations but also offers insights into their strategic financial maneuvers.

Comparing Revenue Performance: Parker-Hannifin Corporation or Elbit Systems Ltd.?
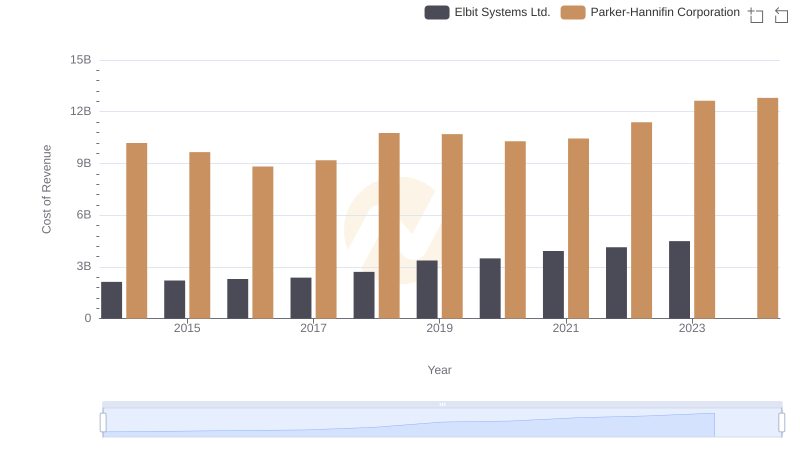
Cost of Revenue Trends: Parker-Hannifin Corporation vs Elbit Systems Ltd.
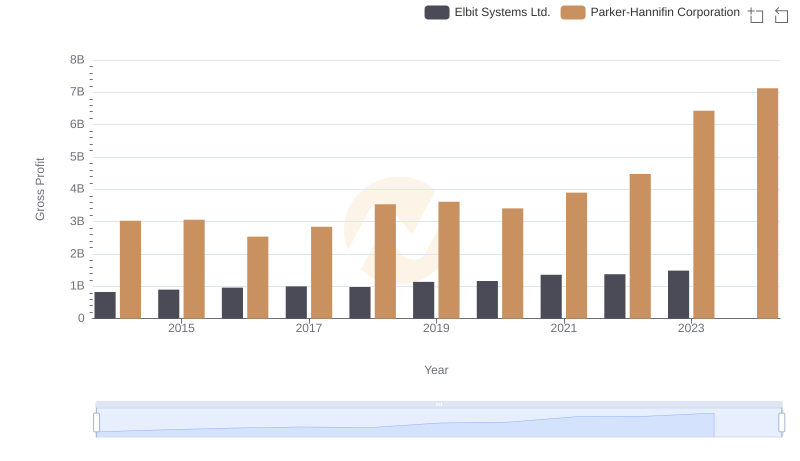
Gross Profit Trends Compared: Parker-Hannifin Corporation vs Elbit Systems Ltd.
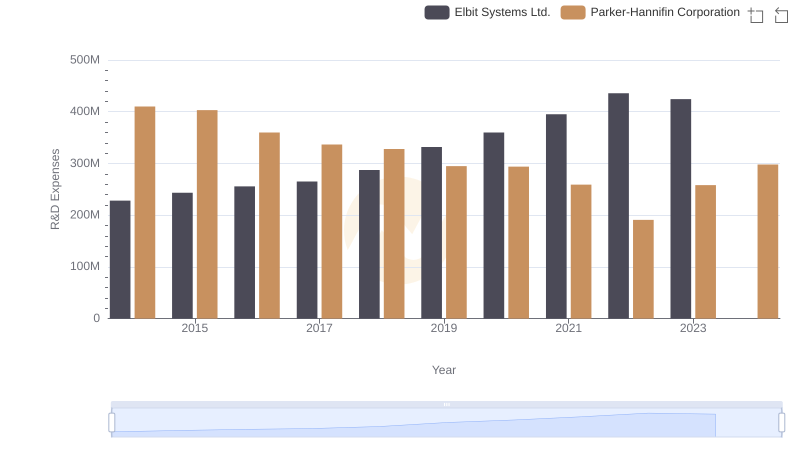
Parker-Hannifin Corporation vs Elbit Systems Ltd.: Strategic Focus on R&D Spending
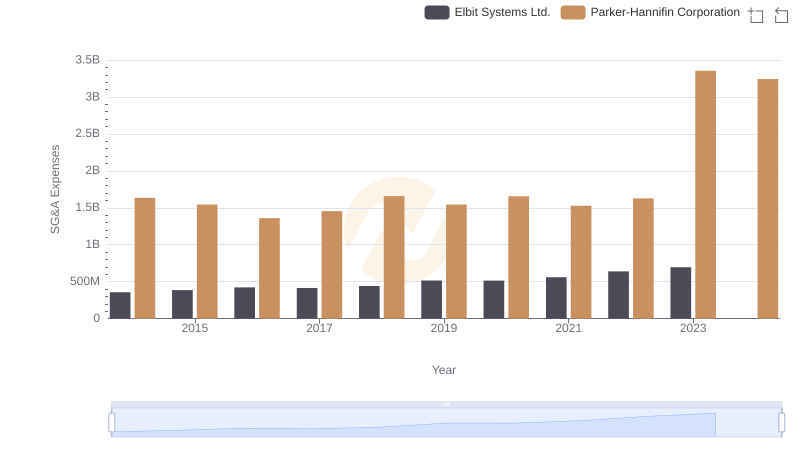
SG&A Efficiency Analysis: Comparing Parker-Hannifin Corporation and Elbit Systems Ltd.
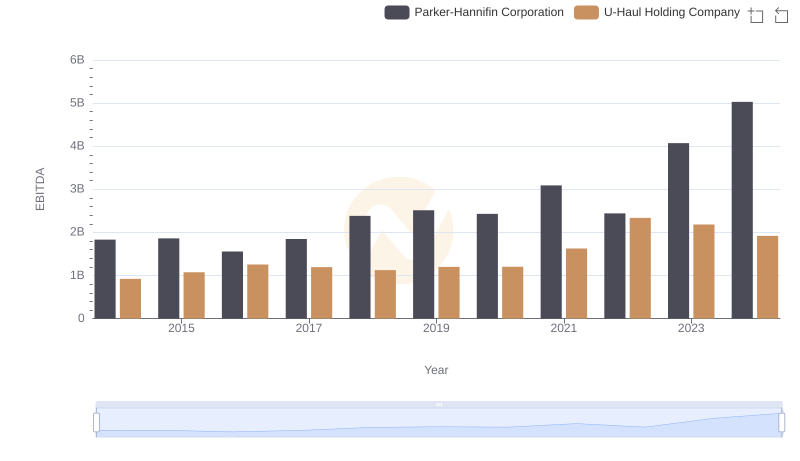
EBITDA Metrics Evaluated: Parker-Hannifin Corporation vs U-Haul Holding Company
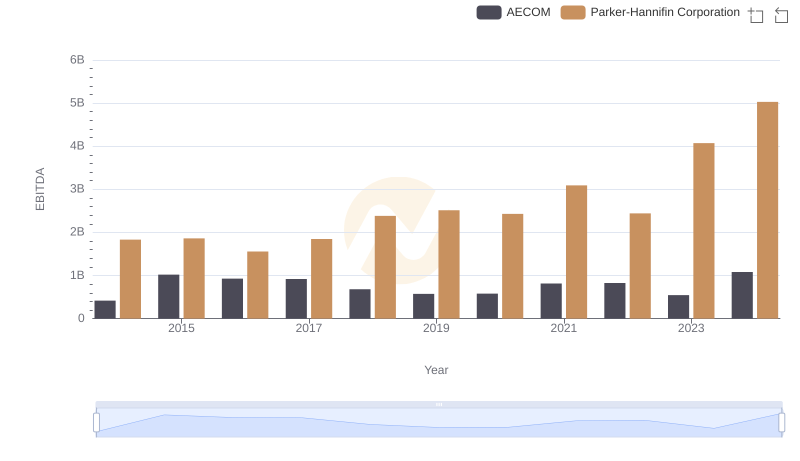
A Professional Review of EBITDA: Parker-Hannifin Corporation Compared to AECOM
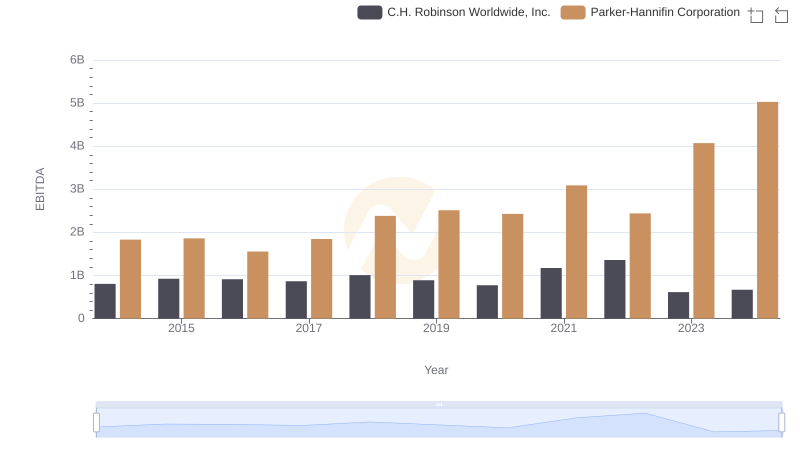
A Side-by-Side Analysis of EBITDA: Parker-Hannifin Corporation and C.H. Robinson Worldwide, Inc.
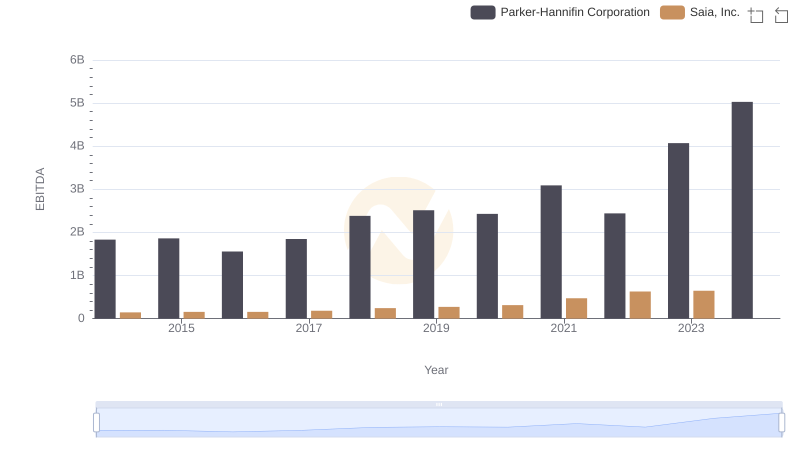
Parker-Hannifin Corporation vs Saia, Inc.: In-Depth EBITDA Performance Comparison
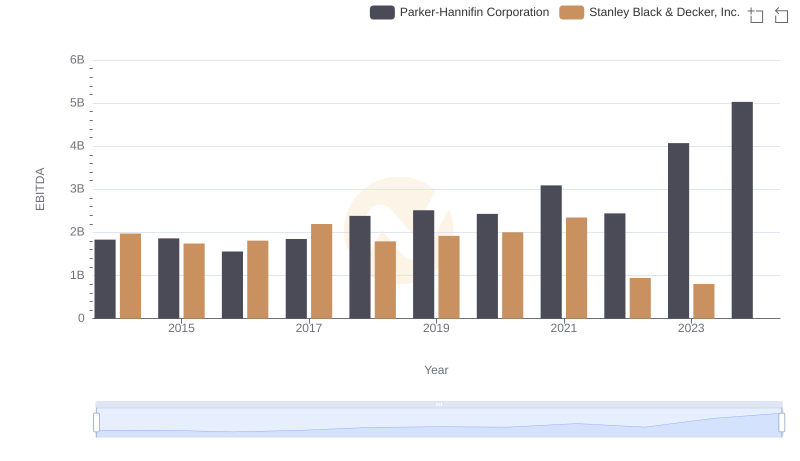
Parker-Hannifin Corporation vs Stanley Black & Decker, Inc.: In-Depth EBITDA Performance Comparison
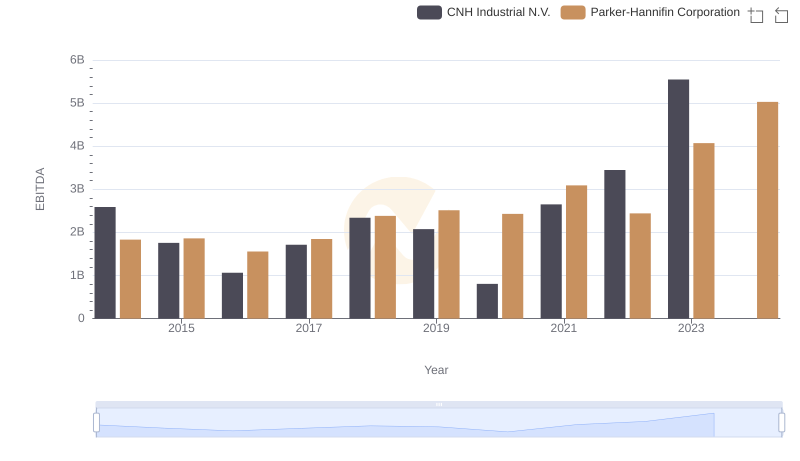
Comprehensive EBITDA Comparison: Parker-Hannifin Corporation vs CNH Industrial N.V.