| __timestamp | AECOM | Parker-Hannifin Corporation |
|---|---|---|
| Wednesday, January 1, 2014 | 417662000 | 1832903000 |
| Thursday, January 1, 2015 | 1020478000 | 1861551000 |
| Friday, January 1, 2016 | 926466000 | 1558088000 |
| Sunday, January 1, 2017 | 920292000 | 1846306000 |
| Monday, January 1, 2018 | 680801000 | 2382235000 |
| Tuesday, January 1, 2019 | 573352000 | 2513468000 |
| Wednesday, January 1, 2020 | 580017000 | 2431500000 |
| Friday, January 1, 2021 | 813356000 | 3092383000 |
| Saturday, January 1, 2022 | 826856000 | 2441242000 |
| Sunday, January 1, 2023 | 543642000 | 4071687000 |
| Monday, January 1, 2024 | 1082384000 | 5028229000 |
Unleashing insights
In the ever-evolving landscape of industrial giants, Parker-Hannifin Corporation and AECOM have showcased intriguing financial trajectories over the past decade. From 2014 to 2024, Parker-Hannifin's EBITDA has consistently outperformed AECOM's, with a notable peak in 2024, reaching approximately 5 billion USD, a staggering 175% increase from its 2014 figures. In contrast, AECOM's EBITDA, while showing growth, has been more volatile, peaking in 2024 at around 1.1 billion USD, marking a 160% rise from 2014.
This financial journey highlights Parker-Hannifin's robust growth strategy, particularly evident in 2023, where its EBITDA surged by 67% compared to the previous year. Meanwhile, AECOM's performance, though commendable, reflects a more fluctuating path, emphasizing the diverse challenges and opportunities within the industry. As we look to the future, these trends offer valuable insights into the strategic maneuvers of these industrial titans.
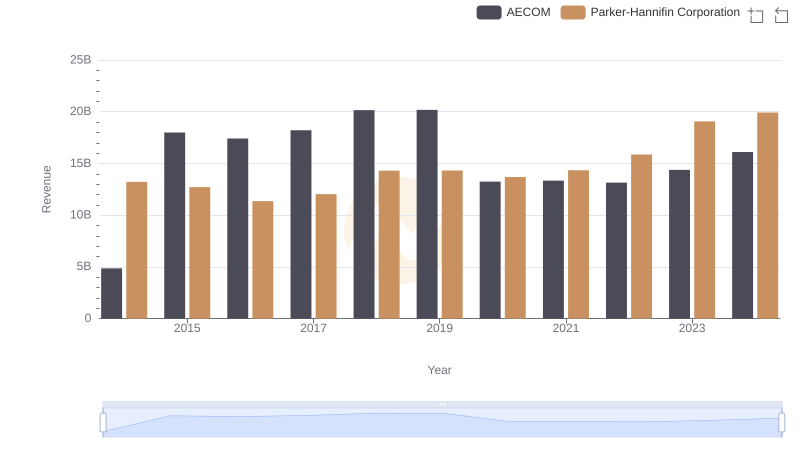
Who Generates More Revenue? Parker-Hannifin Corporation or AECOM
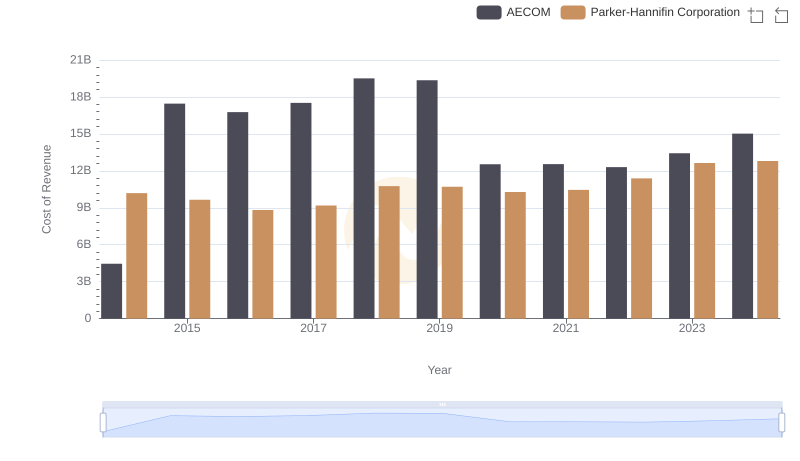
Comparing Cost of Revenue Efficiency: Parker-Hannifin Corporation vs AECOM
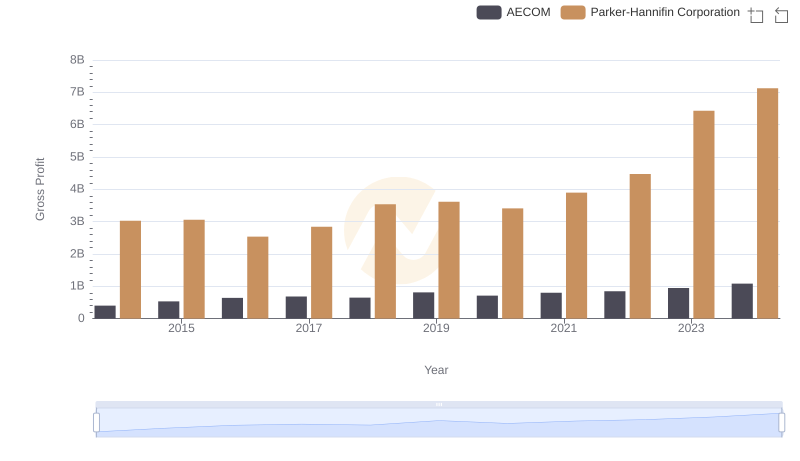
Gross Profit Comparison: Parker-Hannifin Corporation and AECOM Trends
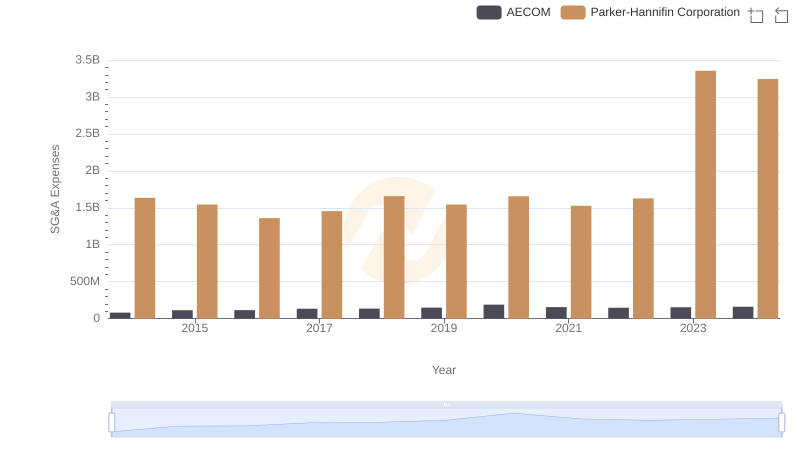
SG&A Efficiency Analysis: Comparing Parker-Hannifin Corporation and AECOM
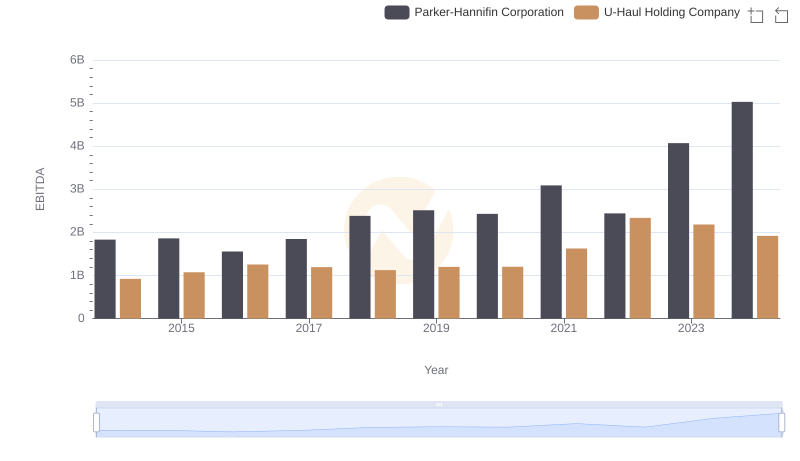
EBITDA Metrics Evaluated: Parker-Hannifin Corporation vs U-Haul Holding Company
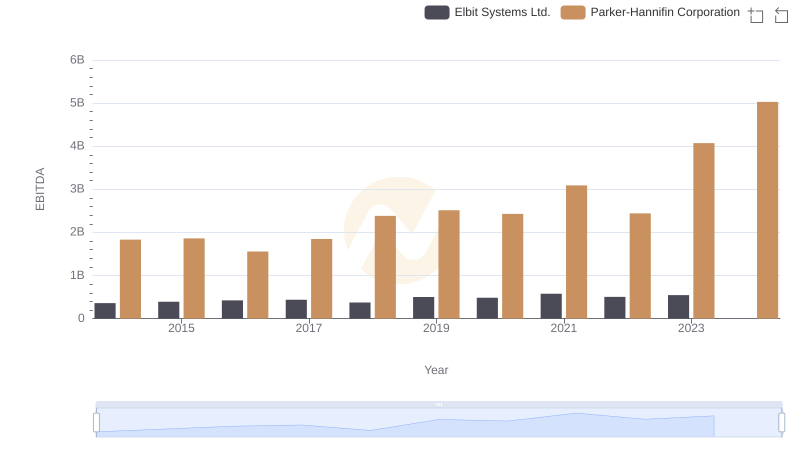
Comprehensive EBITDA Comparison: Parker-Hannifin Corporation vs Elbit Systems Ltd.
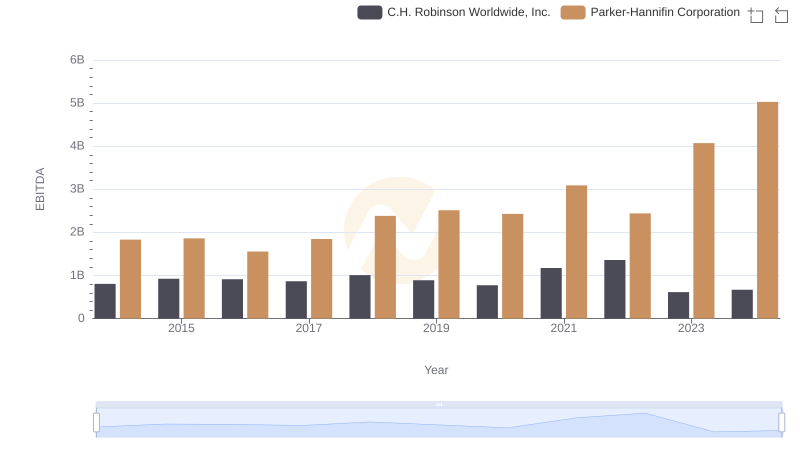
A Side-by-Side Analysis of EBITDA: Parker-Hannifin Corporation and C.H. Robinson Worldwide, Inc.
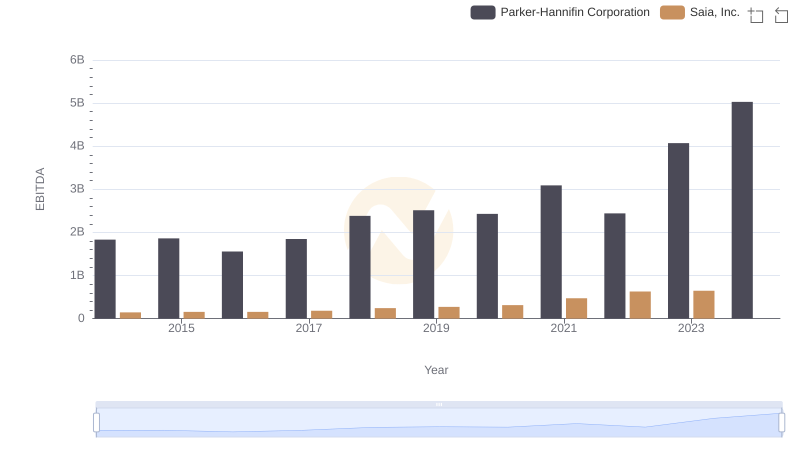
Parker-Hannifin Corporation vs Saia, Inc.: In-Depth EBITDA Performance Comparison
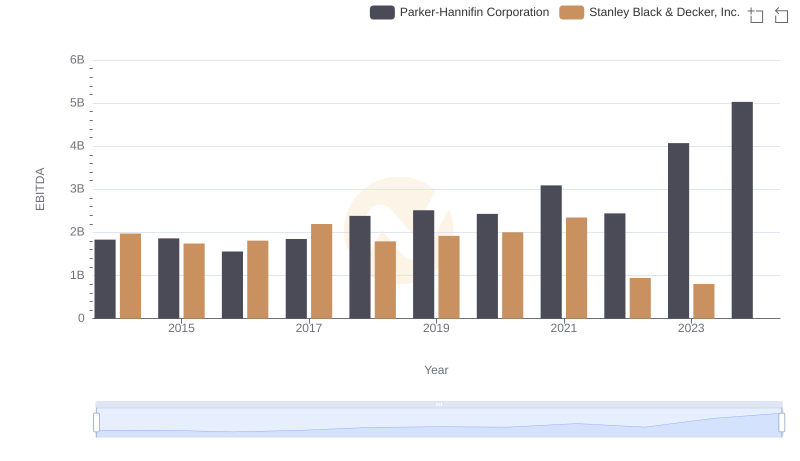
Parker-Hannifin Corporation vs Stanley Black & Decker, Inc.: In-Depth EBITDA Performance Comparison
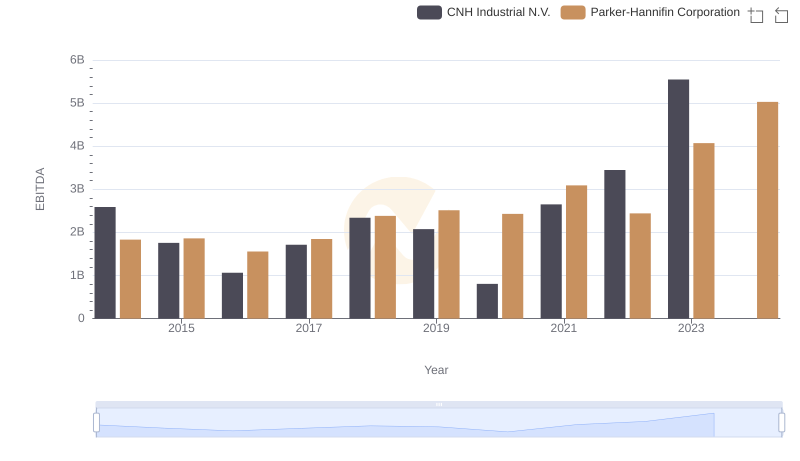
Comprehensive EBITDA Comparison: Parker-Hannifin Corporation vs CNH Industrial N.V.
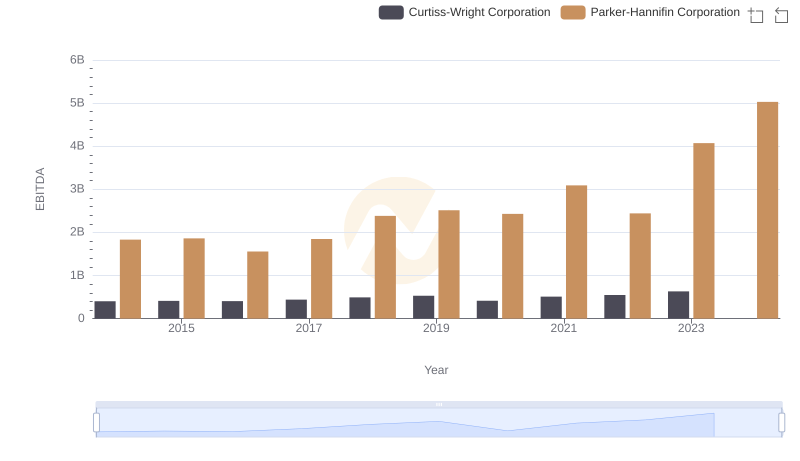
EBITDA Performance Review: Parker-Hannifin Corporation vs Curtiss-Wright Corporation