| __timestamp | Parker-Hannifin Corporation | U-Haul Holding Company |
|---|---|---|
| Wednesday, January 1, 2014 | 10188227000 | 127270000 |
| Thursday, January 1, 2015 | 9655245000 | 146072000 |
| Friday, January 1, 2016 | 8823384000 | 144990000 |
| Sunday, January 1, 2017 | 9188962000 | 152485000 |
| Monday, January 1, 2018 | 10762841000 | 160489000 |
| Tuesday, January 1, 2019 | 10703484000 | 162142000 |
| Wednesday, January 1, 2020 | 10286518000 | 164018000 |
| Friday, January 1, 2021 | 10449680000 | 214059000 |
| Saturday, January 1, 2022 | 11387267000 | 259585000 |
| Sunday, January 1, 2023 | 12635892000 | 844894000 |
| Monday, January 1, 2024 | 12801816000 | 3976040000 |
Igniting the spark of knowledge
In the ever-evolving landscape of corporate expenses, understanding the cost dynamics of industry giants like Parker-Hannifin Corporation and U-Haul Holding Company is crucial. Over the past decade, Parker-Hannifin has consistently maintained a robust cost of revenue, averaging around $10.6 billion annually. This reflects its expansive operations in motion and control technologies. Notably, from 2014 to 2024, Parker-Hannifin's cost of revenue surged by approximately 26%, peaking in 2024.
Conversely, U-Haul, a leader in the moving and storage industry, presents a different narrative. Its cost of revenue, while significantly lower, has shown a remarkable increase of over 3,000% from 2014 to 2024, highlighting its aggressive expansion and adaptation strategies. The year 2023 marked a pivotal point for U-Haul, with costs jumping to nearly $4 billion, indicating a strategic shift or investment.
This comparative analysis underscores the diverse financial strategies employed by these corporations, offering valuable insights into their operational priorities and market positioning.
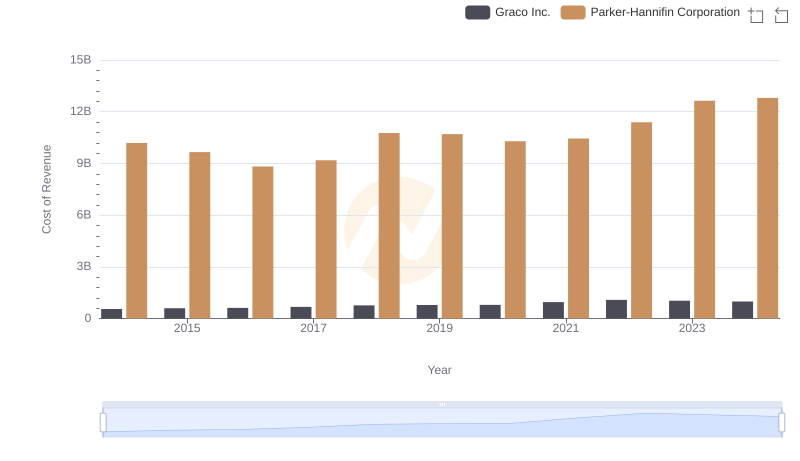
Cost of Revenue: Key Insights for Parker-Hannifin Corporation and Graco Inc.
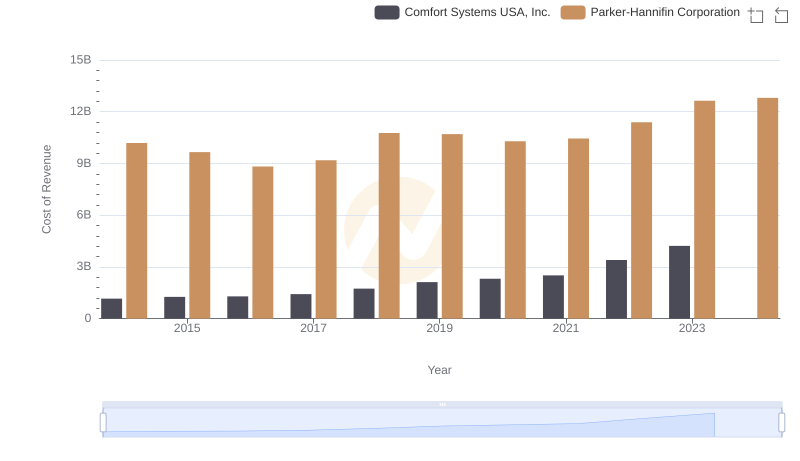
Cost of Revenue Comparison: Parker-Hannifin Corporation vs Comfort Systems USA, Inc.
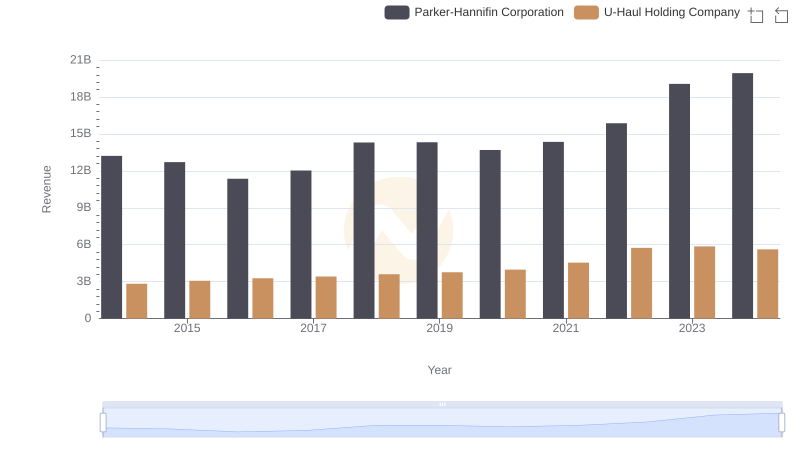
Parker-Hannifin Corporation vs U-Haul Holding Company: Annual Revenue Growth Compared
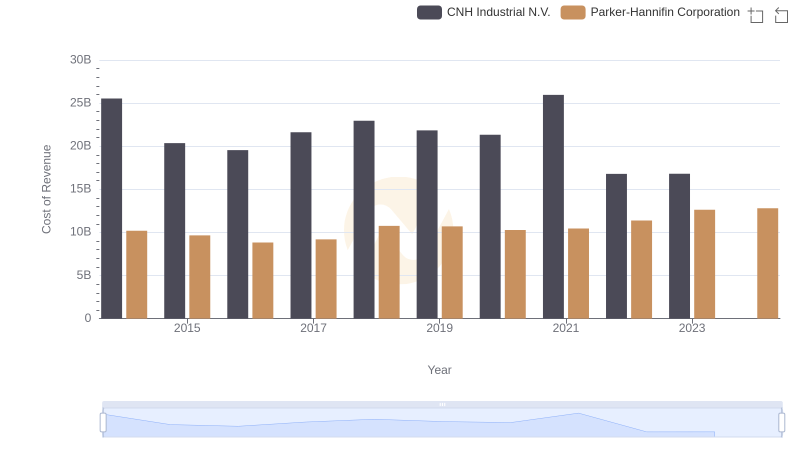
Analyzing Cost of Revenue: Parker-Hannifin Corporation and CNH Industrial N.V.
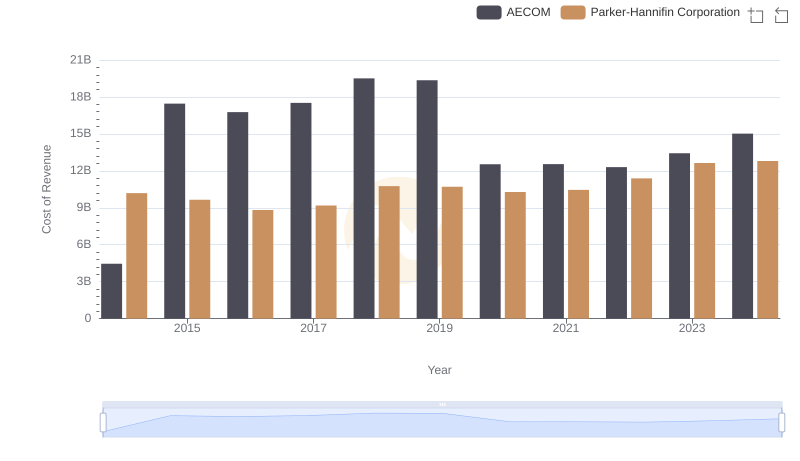
Comparing Cost of Revenue Efficiency: Parker-Hannifin Corporation vs AECOM
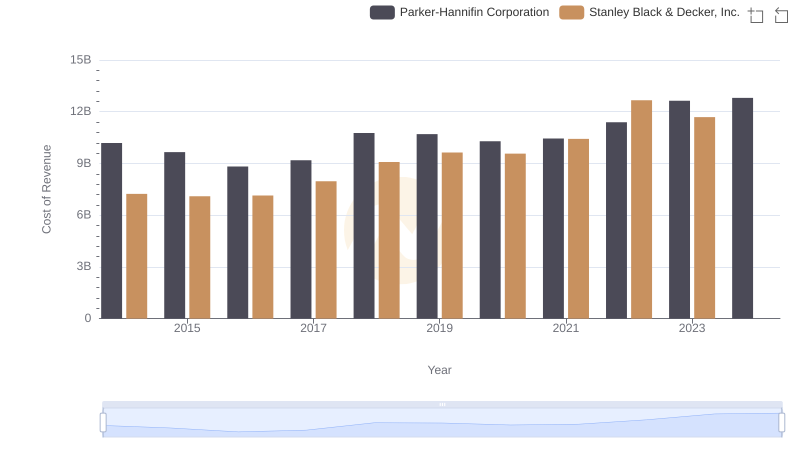
Analyzing Cost of Revenue: Parker-Hannifin Corporation and Stanley Black & Decker, Inc.
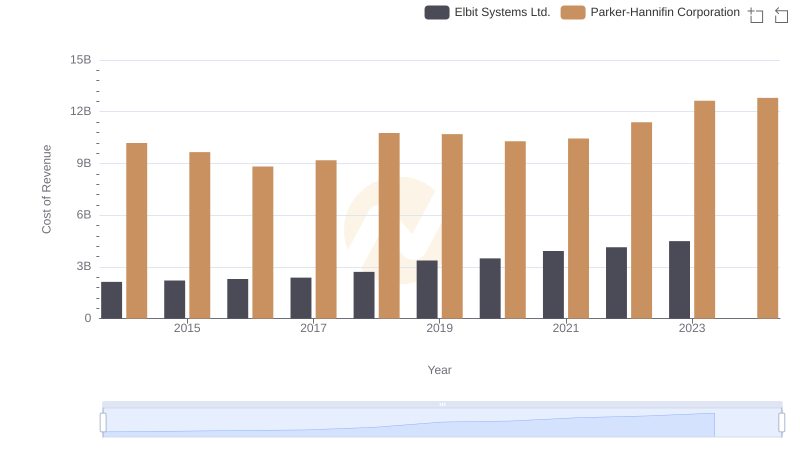
Cost of Revenue Trends: Parker-Hannifin Corporation vs Elbit Systems Ltd.
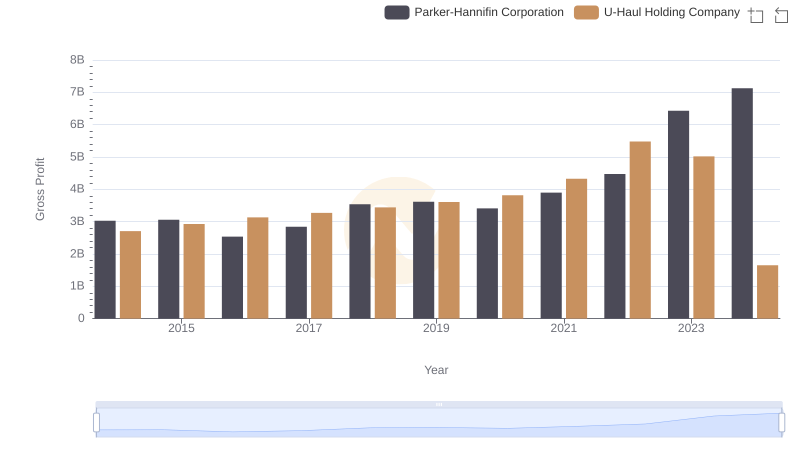
Gross Profit Trends Compared: Parker-Hannifin Corporation vs U-Haul Holding Company
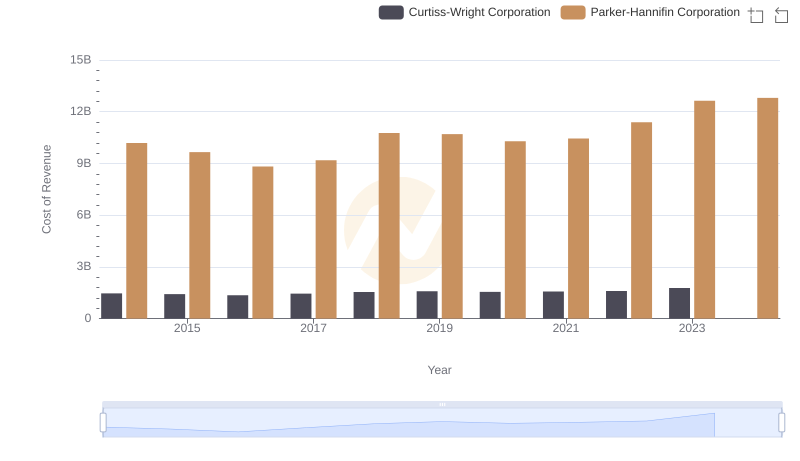
Analyzing Cost of Revenue: Parker-Hannifin Corporation and Curtiss-Wright Corporation
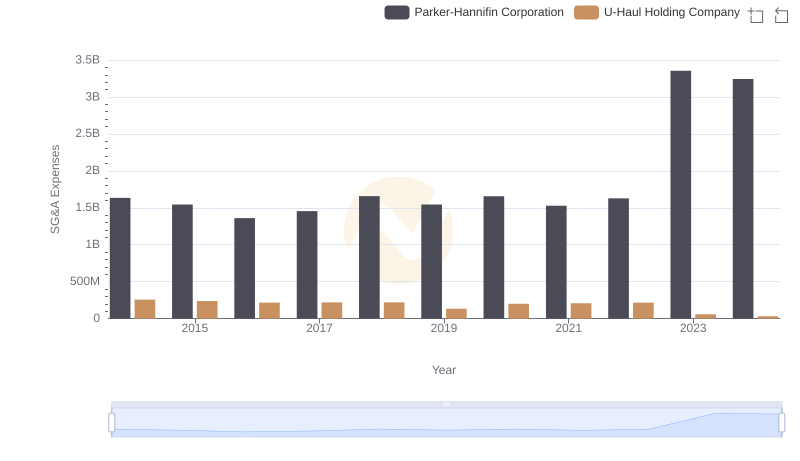
Operational Costs Compared: SG&A Analysis of Parker-Hannifin Corporation and U-Haul Holding Company
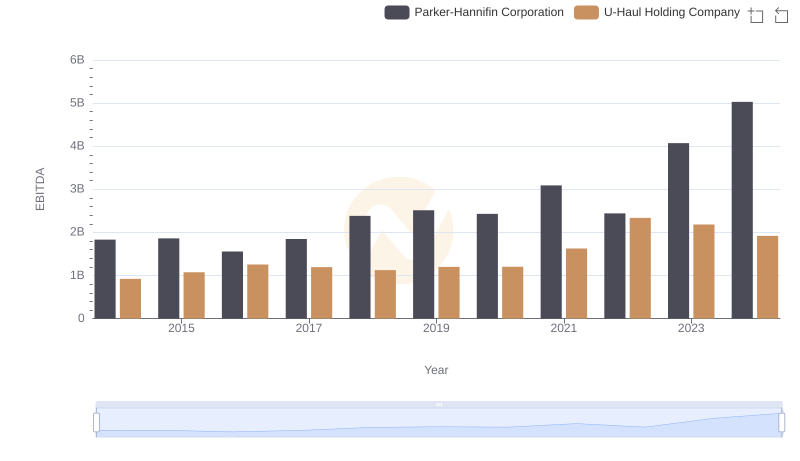
EBITDA Metrics Evaluated: Parker-Hannifin Corporation vs U-Haul Holding Company