| __timestamp | International Business Machines Corporation | Tyler Technologies, Inc. |
|---|---|---|
| Wednesday, January 1, 2014 | 92793000000 | 493101000 |
| Thursday, January 1, 2015 | 81742000000 | 591022000 |
| Friday, January 1, 2016 | 79920000000 | 756043000 |
| Sunday, January 1, 2017 | 79139000000 | 840662000 |
| Monday, January 1, 2018 | 79591000000 | 935282000 |
| Tuesday, January 1, 2019 | 57714000000 | 1086427000 |
| Wednesday, January 1, 2020 | 55179000000 | 1116663000 |
| Friday, January 1, 2021 | 57351000000 | 1592287000 |
| Saturday, January 1, 2022 | 60530000000 | 1850204000 |
| Sunday, January 1, 2023 | 61860000000 | 1951751000 |
| Monday, January 1, 2024 | 62753000000 | 2137803000 |
Unleashing insights
In the ever-evolving landscape of technology, International Business Machines Corporation (IBM) and Tyler Technologies, Inc. stand as intriguing contrasts. Over the past decade, IBM's revenue has seen a decline of approximately 33%, from 92.8 billion in 2014 to 61.9 billion in 2023. This trend reflects IBM's strategic shift towards cloud computing and AI, amidst a challenging market environment.
Conversely, Tyler Technologies, a leader in public sector software solutions, has experienced a remarkable growth trajectory. From 2014 to 2023, Tyler's revenue surged by nearly 300%, reaching 1.95 billion. This growth underscores the increasing demand for digital transformation in government services.
As we delve into these revenue trends, it becomes evident that while IBM is navigating a transformative phase, Tyler Technologies is capitalizing on its niche market, setting the stage for an exciting future in tech.
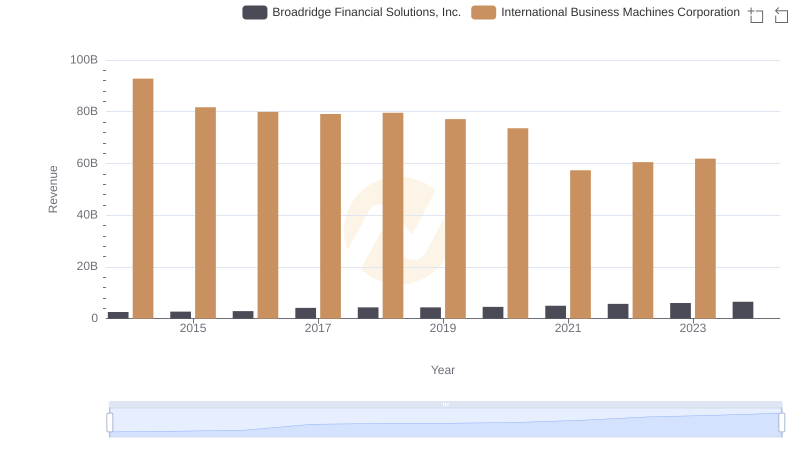
Revenue Insights: International Business Machines Corporation and Broadridge Financial Solutions, Inc. Performance Compared
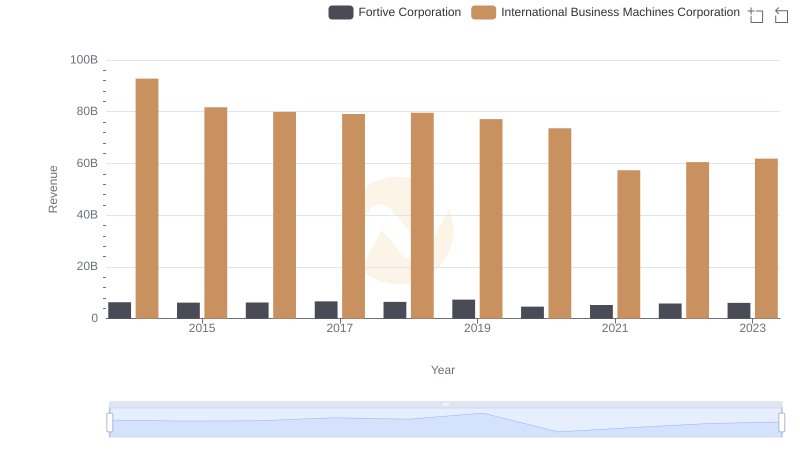
Annual Revenue Comparison: International Business Machines Corporation vs Fortive Corporation
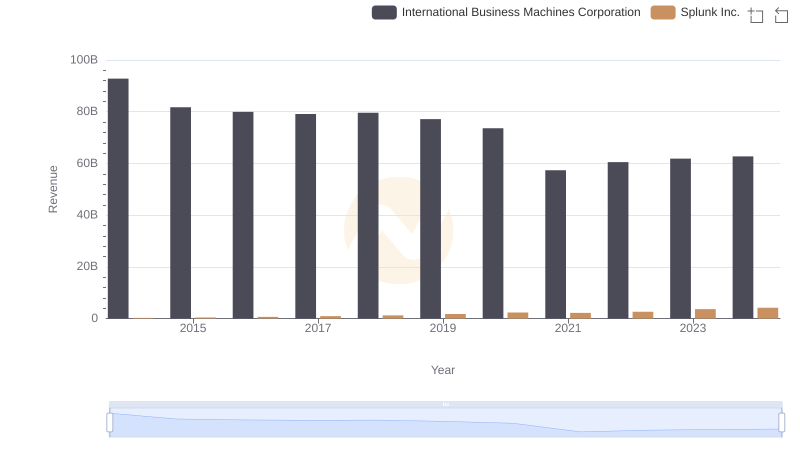
Comparing Revenue Performance: International Business Machines Corporation or Splunk Inc.?
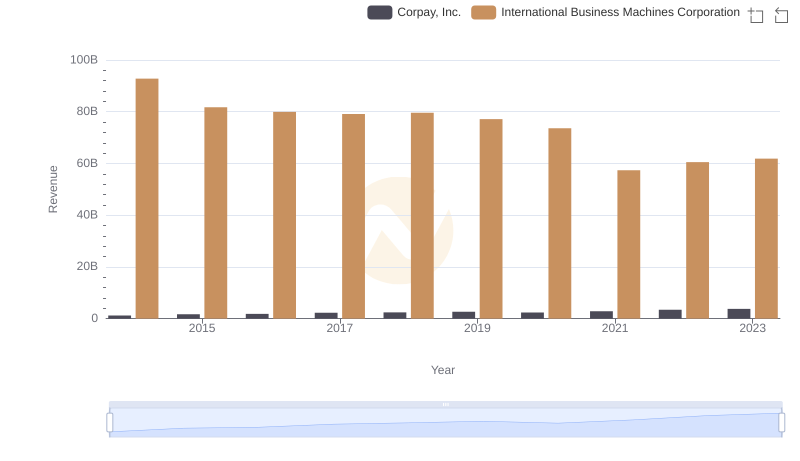
Comparing Revenue Performance: International Business Machines Corporation or Corpay, Inc.?
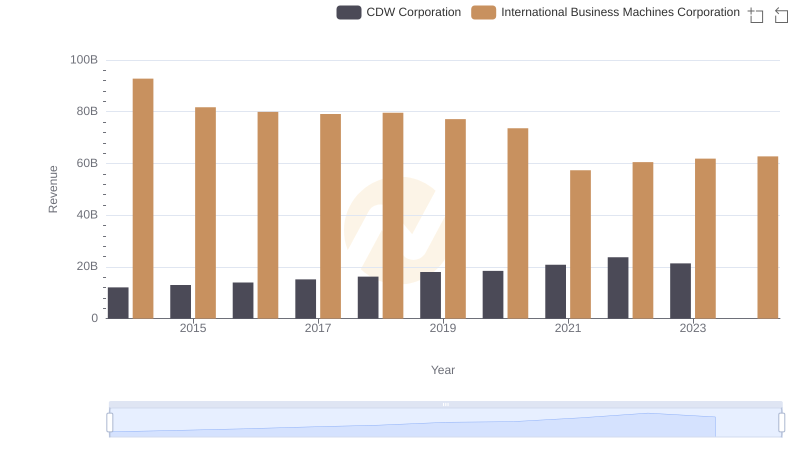
Who Generates More Revenue? International Business Machines Corporation or CDW Corporation
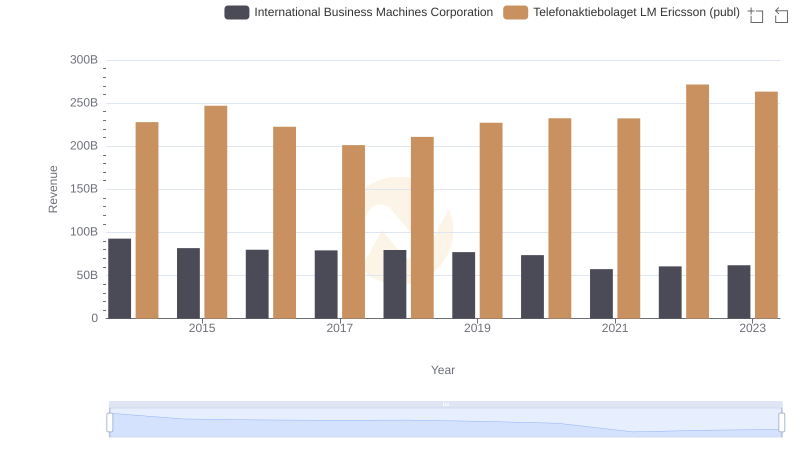
Comparing Revenue Performance: International Business Machines Corporation or Telefonaktiebolaget LM Ericsson (publ)?
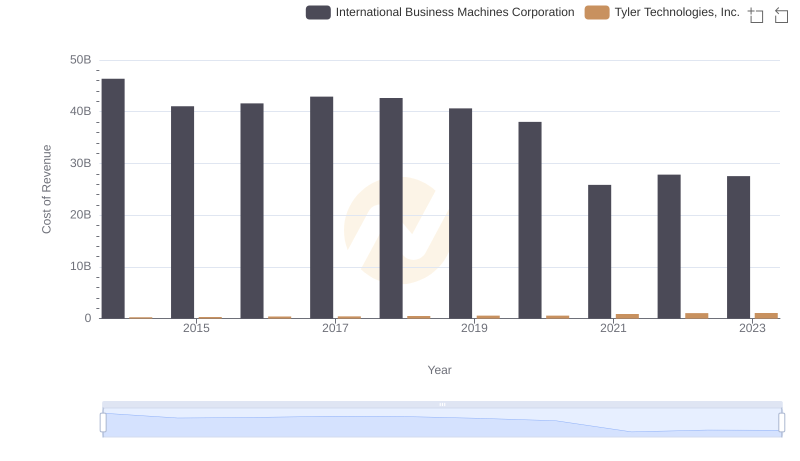
Cost of Revenue: Key Insights for International Business Machines Corporation and Tyler Technologies, Inc.
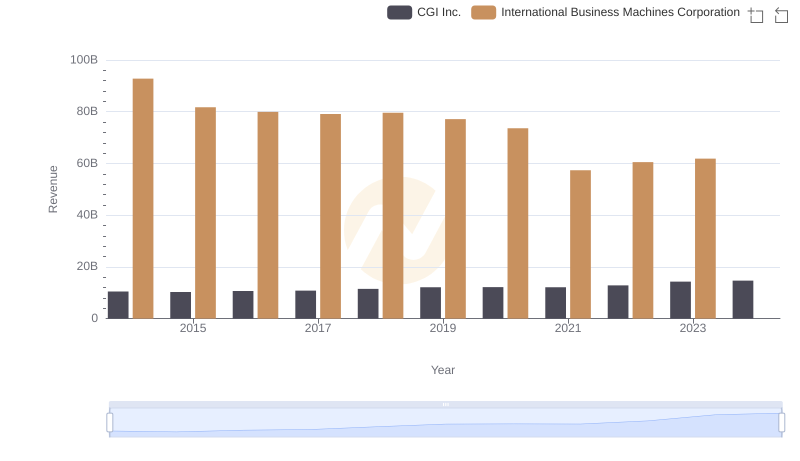
Revenue Insights: International Business Machines Corporation and CGI Inc. Performance Compared
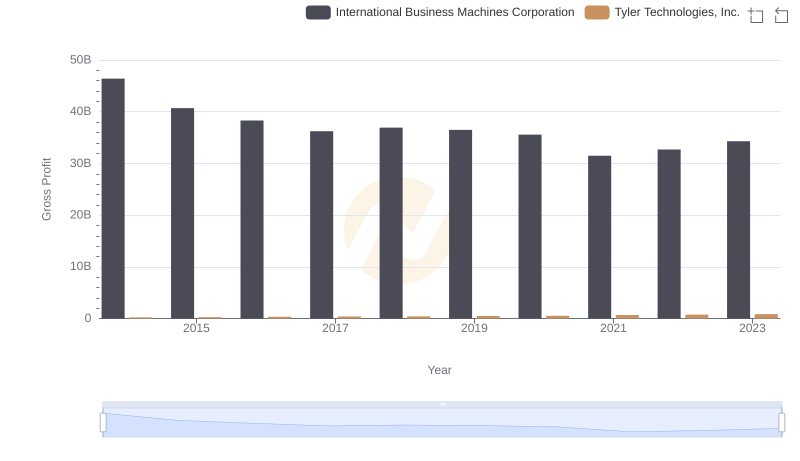
Gross Profit Analysis: Comparing International Business Machines Corporation and Tyler Technologies, Inc.
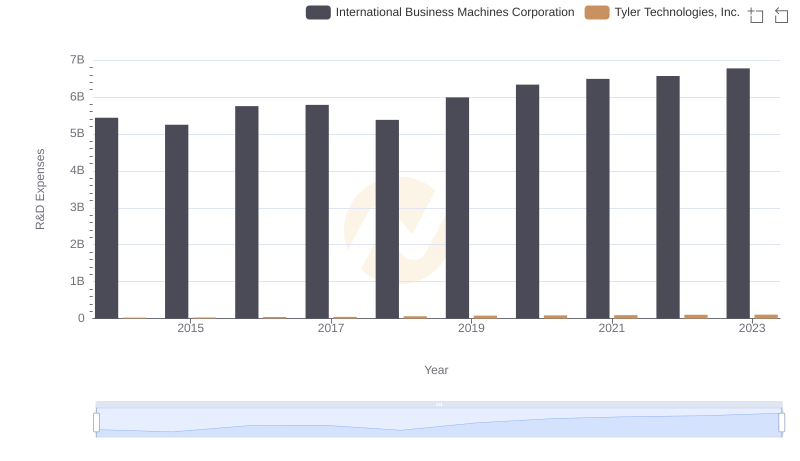
Research and Development Investment: International Business Machines Corporation vs Tyler Technologies, Inc.
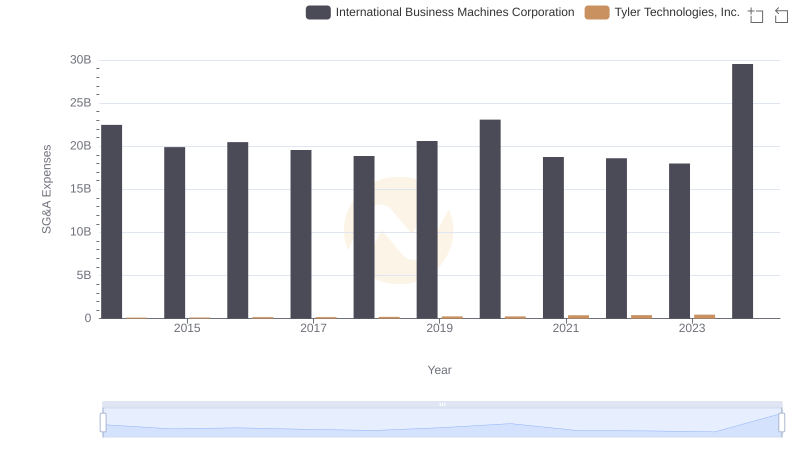
Comparing SG&A Expenses: International Business Machines Corporation vs Tyler Technologies, Inc. Trends and Insights
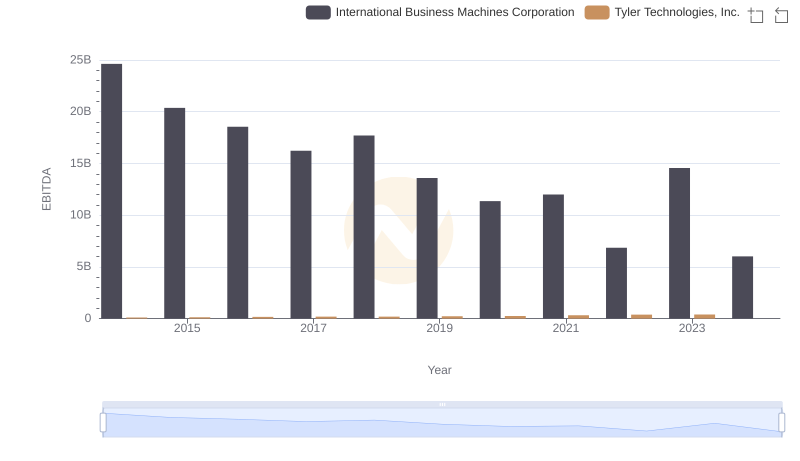
EBITDA Metrics Evaluated: International Business Machines Corporation vs Tyler Technologies, Inc.