| __timestamp | International Business Machines Corporation | Tyler Technologies, Inc. |
|---|---|---|
| Wednesday, January 1, 2014 | 22472000000 | 108260000 |
| Thursday, January 1, 2015 | 19894000000 | 133317000 |
| Friday, January 1, 2016 | 20279000000 | 167161000 |
| Sunday, January 1, 2017 | 19680000000 | 176974000 |
| Monday, January 1, 2018 | 19366000000 | 207605000 |
| Tuesday, January 1, 2019 | 18724000000 | 257746000 |
| Wednesday, January 1, 2020 | 20561000000 | 259561000 |
| Friday, January 1, 2021 | 18745000000 | 390579000 |
| Saturday, January 1, 2022 | 17483000000 | 403067000 |
| Sunday, January 1, 2023 | 17997000000 | 458345000 |
| Monday, January 1, 2024 | 29536000000 | 458669000 |
Infusing magic into the data realm
In the ever-evolving landscape of technology, understanding the financial strategies of industry giants is crucial. This chart offers a fascinating glimpse into the Selling, General, and Administrative (SG&A) expenses of International Business Machines Corporation (IBM) and Tyler Technologies, Inc. over the past decade.
IBM, a stalwart in the tech industry, has seen its SG&A expenses fluctuate, peaking in 2024 with a 30% increase from 2023. This suggests a strategic shift, possibly towards innovation or market expansion.
Conversely, Tyler Technologies, a leader in public sector software, has consistently increased its SG&A expenses, reflecting a robust growth strategy. From 2014 to 2023, their expenses surged by over 300%, indicating aggressive market penetration and expansion efforts.
While IBM's expenses show variability, Tyler's steady rise highlights its commitment to scaling operations. Missing data for 2024 suggests ongoing developments worth monitoring.
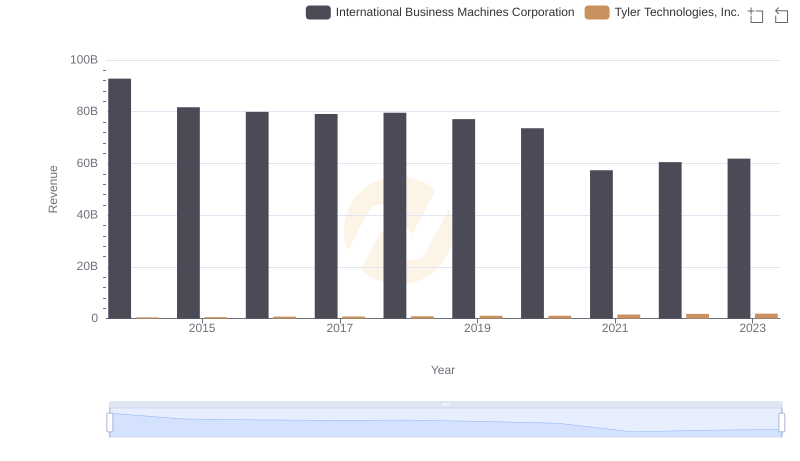
International Business Machines Corporation vs Tyler Technologies, Inc.: Examining Key Revenue Metrics
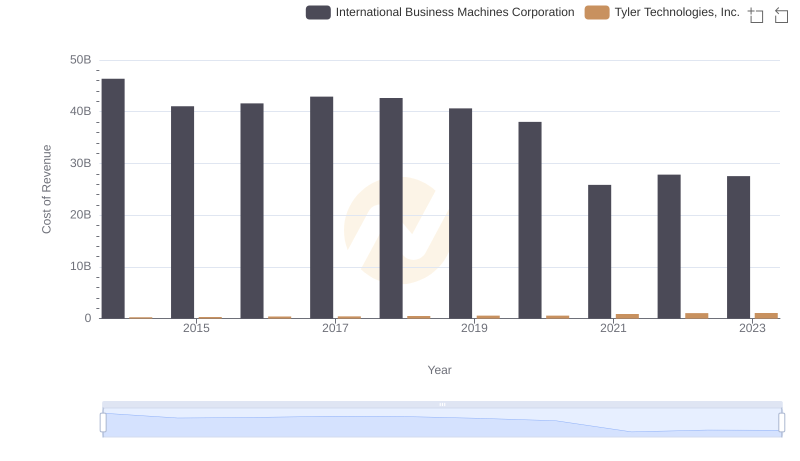
Cost of Revenue: Key Insights for International Business Machines Corporation and Tyler Technologies, Inc.
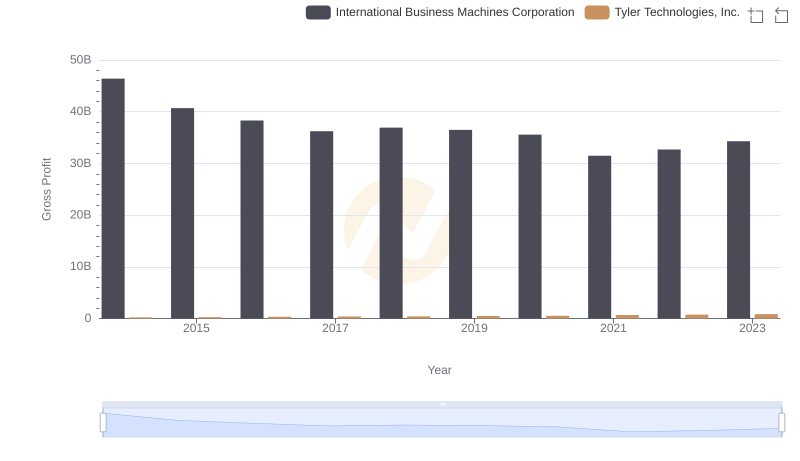
Gross Profit Analysis: Comparing International Business Machines Corporation and Tyler Technologies, Inc.
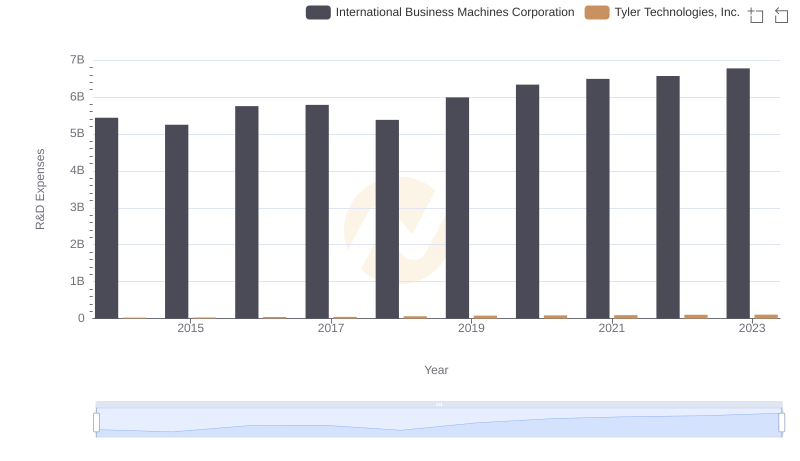
Research and Development Investment: International Business Machines Corporation vs Tyler Technologies, Inc.
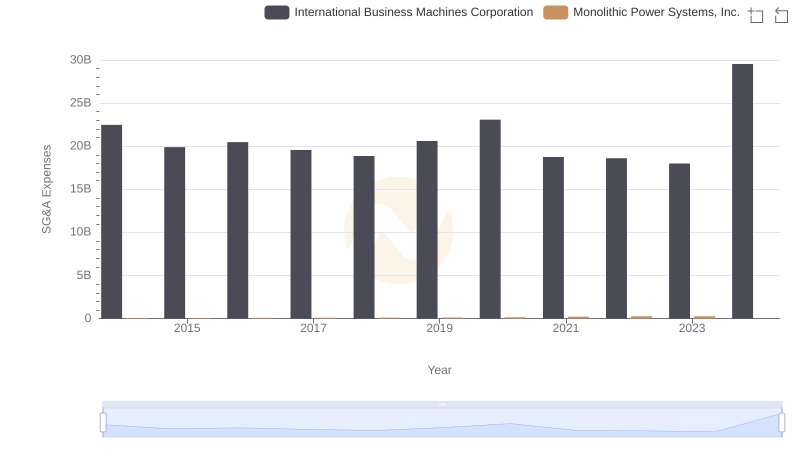
SG&A Efficiency Analysis: Comparing International Business Machines Corporation and Monolithic Power Systems, Inc.
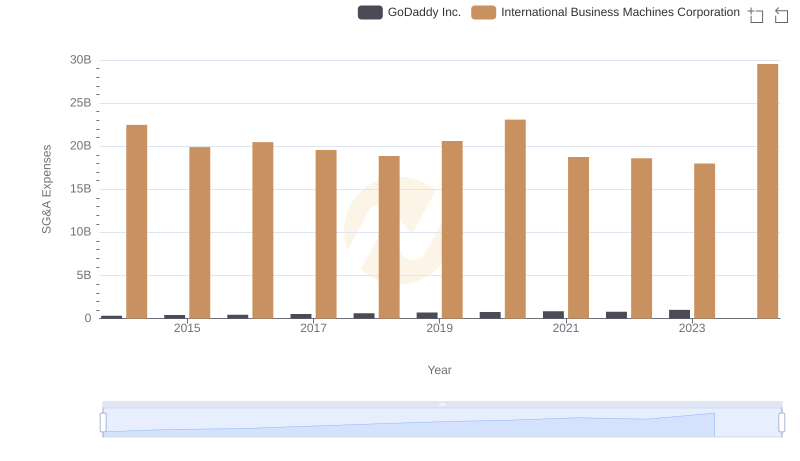
Cost Management Insights: SG&A Expenses for International Business Machines Corporation and GoDaddy Inc.
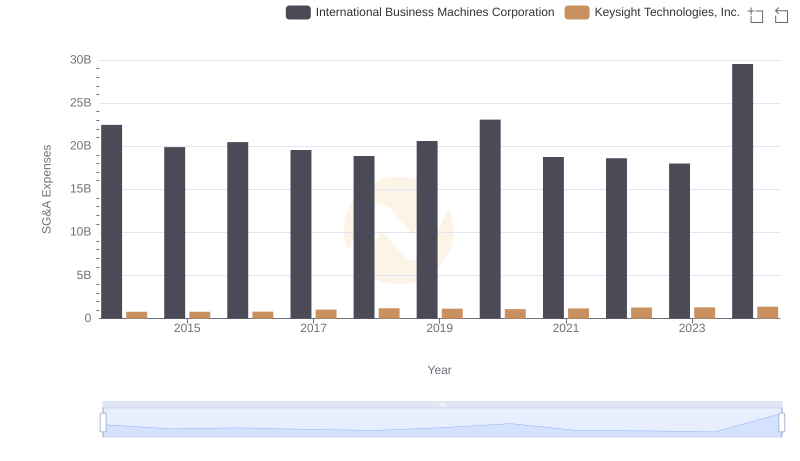
Cost Management Insights: SG&A Expenses for International Business Machines Corporation and Keysight Technologies, Inc.
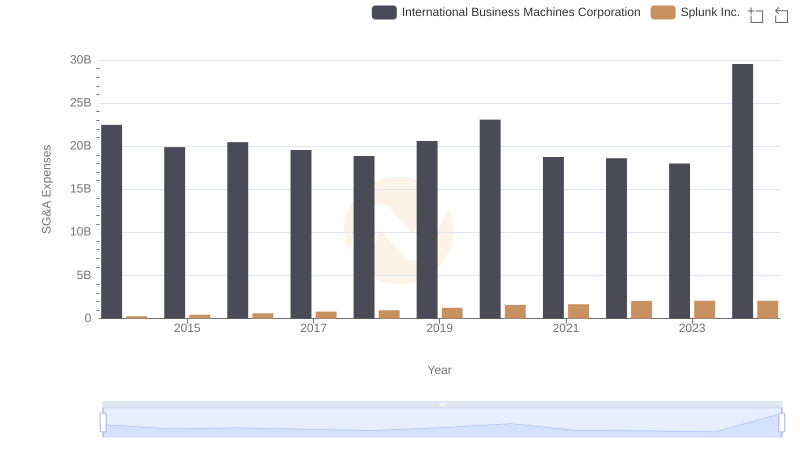
Selling, General, and Administrative Costs: International Business Machines Corporation vs Splunk Inc.

Breaking Down SG&A Expenses: International Business Machines Corporation vs Corpay, Inc.
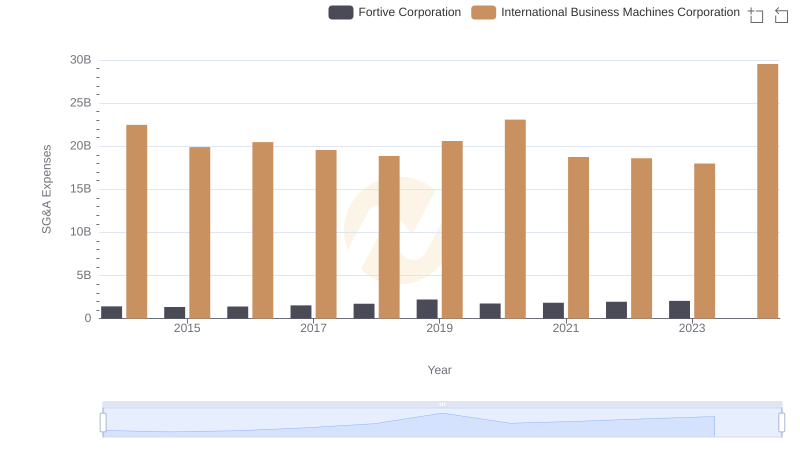
Who Optimizes SG&A Costs Better? International Business Machines Corporation or Fortive Corporation
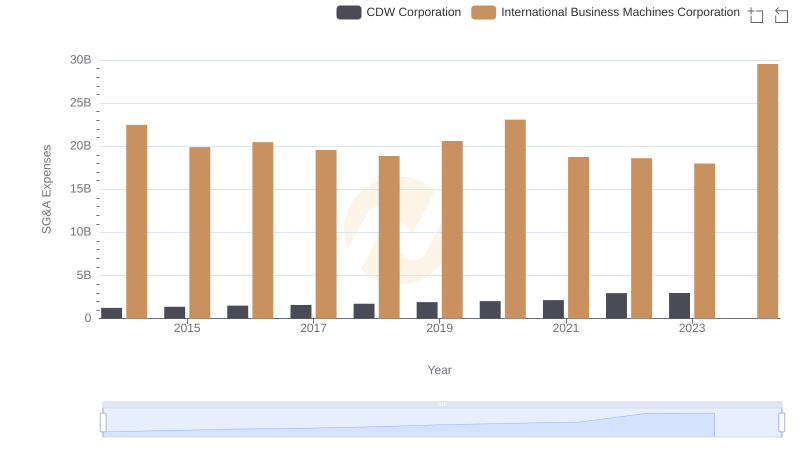
International Business Machines Corporation vs CDW Corporation: SG&A Expense Trends
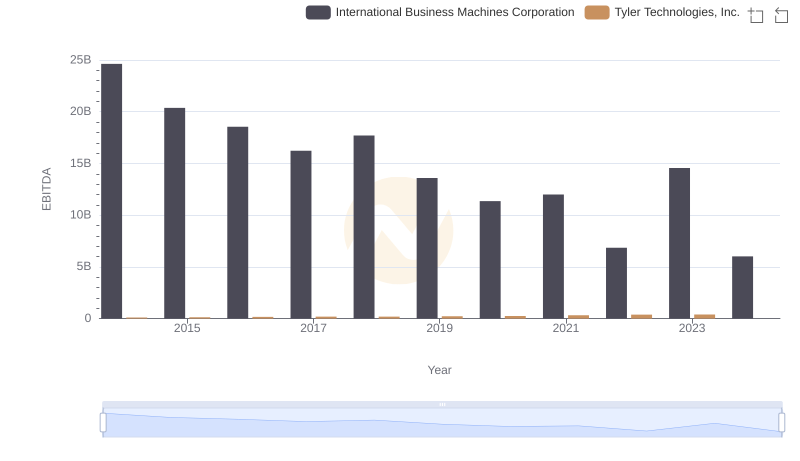
EBITDA Metrics Evaluated: International Business Machines Corporation vs Tyler Technologies, Inc.