| __timestamp | Automatic Data Processing, Inc. | Jacobs Engineering Group Inc. |
|---|---|---|
| Wednesday, January 1, 2014 | 4611400000 | 2073784000 |
| Thursday, January 1, 2015 | 4133200000 | 1968338000 |
| Friday, January 1, 2016 | 4450200000 | 1767831000 |
| Sunday, January 1, 2017 | 4712600000 | 1772252000 |
| Monday, January 1, 2018 | 5016700000 | 2828370000 |
| Tuesday, January 1, 2019 | 5526700000 | 2477028000 |
| Wednesday, January 1, 2020 | 6144700000 | 2586668000 |
| Friday, January 1, 2021 | 6365100000 | 3043772000 |
| Saturday, January 1, 2022 | 7036400000 | 3327040000 |
| Sunday, January 1, 2023 | 8058800000 | 3473315000 |
| Monday, January 1, 2024 | 8725900000 | 2832756000 |
Infusing magic into the data realm
In the ever-evolving landscape of corporate finance, understanding the gross profit trends of industry giants like Automatic Data Processing, Inc. (ADP) and Jacobs Engineering Group Inc. is crucial. Over the past decade, ADP has consistently outperformed Jacobs Engineering in terms of gross profit, showcasing a robust growth trajectory. From 2014 to 2023, ADP's gross profit surged by approximately 89%, peaking in 2023, while Jacobs Engineering saw a more modest increase of around 67% during the same period.
ADP's strategic focus on automation and digital solutions has propelled its financial success, while Jacobs Engineering's growth reflects its expansion into diverse engineering sectors. The data highlights a pivotal moment in 2020 when both companies experienced significant growth, with ADP's gross profit increasing by 11% and Jacobs Engineering by 23% compared to the previous year. This analysis underscores the dynamic nature of these companies' financial journeys, offering valuable insights for investors and industry analysts alike.
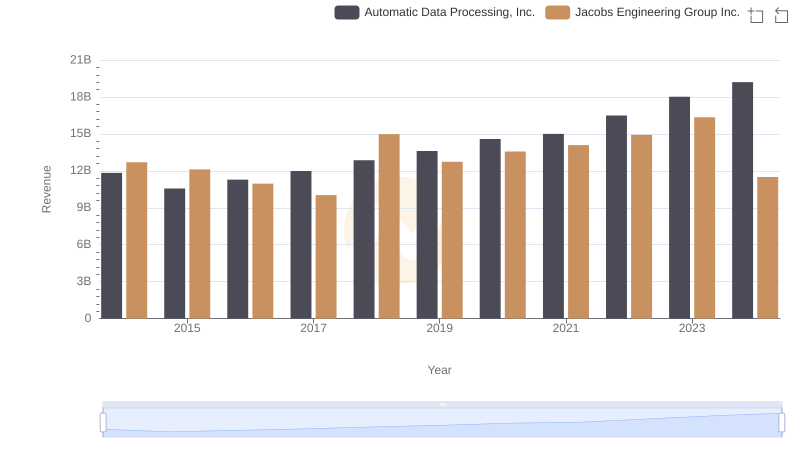
Automatic Data Processing, Inc. or Jacobs Engineering Group Inc.: Who Leads in Yearly Revenue?
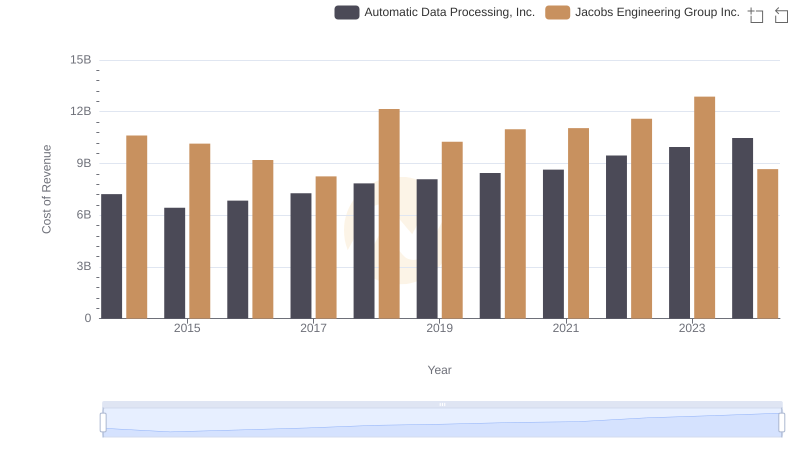
Automatic Data Processing, Inc. vs Jacobs Engineering Group Inc.: Efficiency in Cost of Revenue Explored
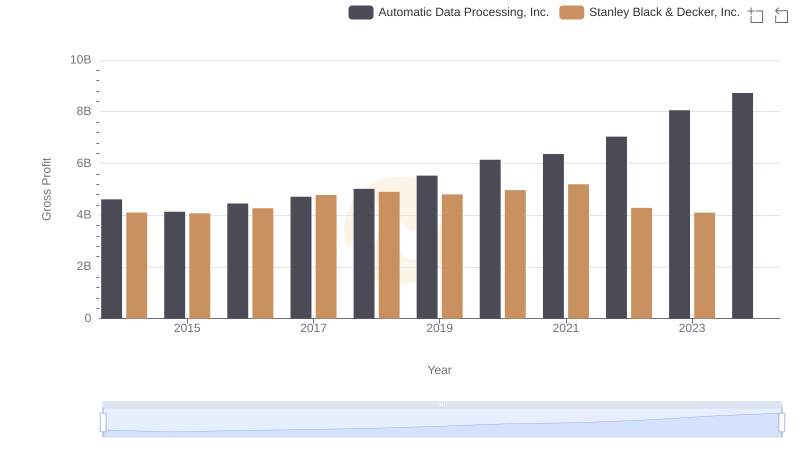
Gross Profit Analysis: Comparing Automatic Data Processing, Inc. and Stanley Black & Decker, Inc.
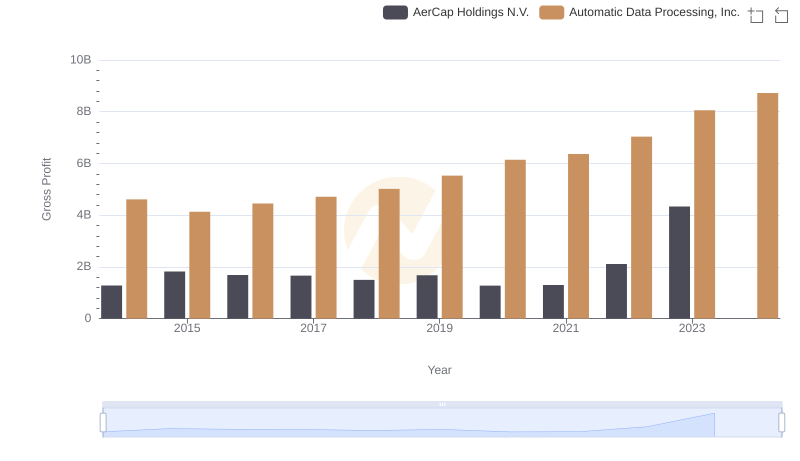
Key Insights on Gross Profit: Automatic Data Processing, Inc. vs AerCap Holdings N.V.
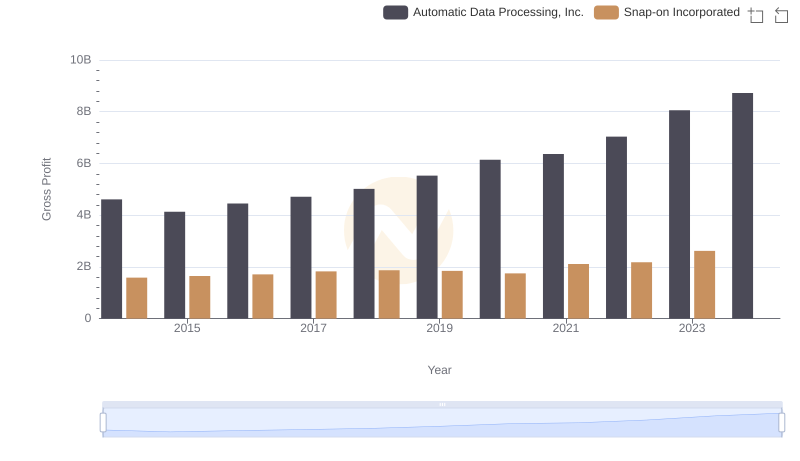
Automatic Data Processing, Inc. and Snap-on Incorporated: A Detailed Gross Profit Analysis
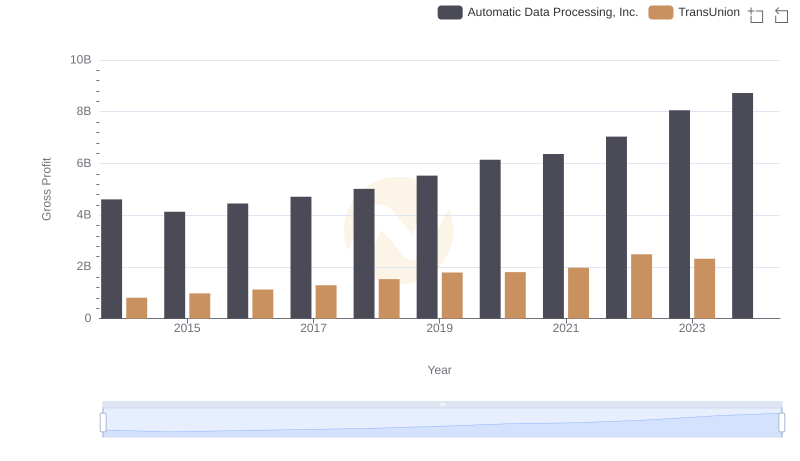
Key Insights on Gross Profit: Automatic Data Processing, Inc. vs TransUnion
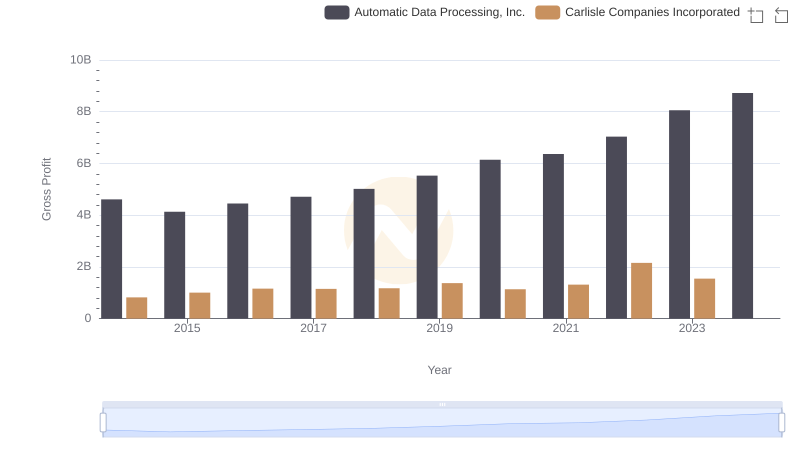
Who Generates Higher Gross Profit? Automatic Data Processing, Inc. or Carlisle Companies Incorporated
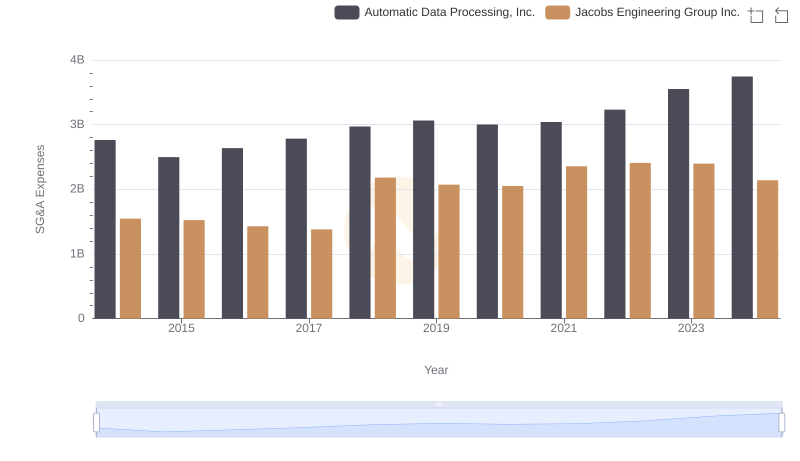
Who Optimizes SG&A Costs Better? Automatic Data Processing, Inc. or Jacobs Engineering Group Inc.
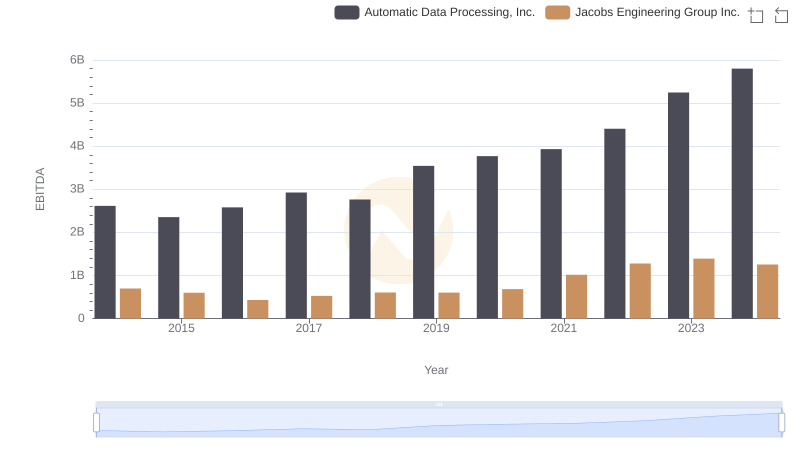
EBITDA Metrics Evaluated: Automatic Data Processing, Inc. vs Jacobs Engineering Group Inc.