| __timestamp | Automatic Data Processing, Inc. | Jacobs Engineering Group Inc. |
|---|---|---|
| Wednesday, January 1, 2014 | 7221400000 | 10621373000 |
| Thursday, January 1, 2015 | 6427600000 | 10146494000 |
| Friday, January 1, 2016 | 6840300000 | 9196326000 |
| Sunday, January 1, 2017 | 7269800000 | 8250536000 |
| Monday, January 1, 2018 | 7842600000 | 12156276000 |
| Tuesday, January 1, 2019 | 8086600000 | 10260840000 |
| Wednesday, January 1, 2020 | 8445100000 | 10980307000 |
| Friday, January 1, 2021 | 8640300000 | 11048860000 |
| Saturday, January 1, 2022 | 9461900000 | 11595785000 |
| Sunday, January 1, 2023 | 9953400000 | 12879099000 |
| Monday, January 1, 2024 | 10476700000 | 8668185000 |
Unlocking the unknown
In the ever-evolving landscape of corporate finance, understanding cost efficiency is paramount. This analysis delves into the cost of revenue trends for Automatic Data Processing, Inc. (ADP) and Jacobs Engineering Group Inc. from 2014 to 2024. Over this decade, ADP's cost of revenue increased by approximately 45%, reflecting a steady growth trajectory. In contrast, Jacobs Engineering experienced a more volatile pattern, with a peak in 2023 before a significant drop in 2024, marking a 33% decrease from the previous year.
ADP's consistent rise suggests a stable operational model, while Jacobs' fluctuations may indicate strategic shifts or market challenges. This comparison not only highlights the differing financial strategies of these industry giants but also underscores the importance of cost management in maintaining competitive advantage. As businesses navigate the complexities of the modern economy, such insights are invaluable for stakeholders and investors alike.
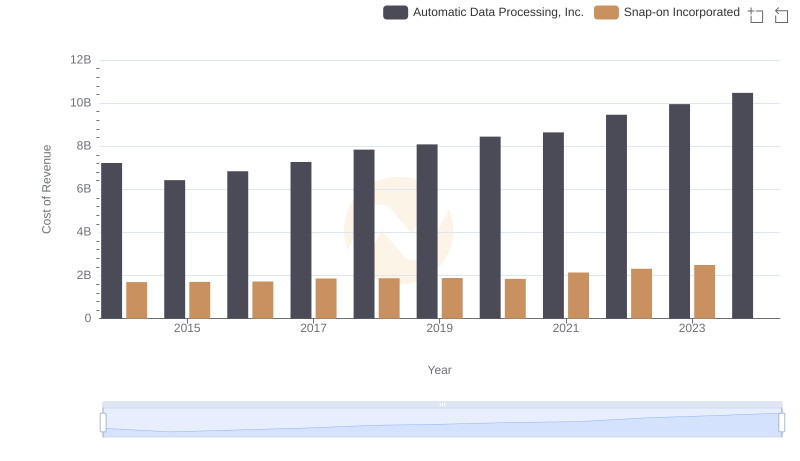
Cost of Revenue: Key Insights for Automatic Data Processing, Inc. and Snap-on Incorporated
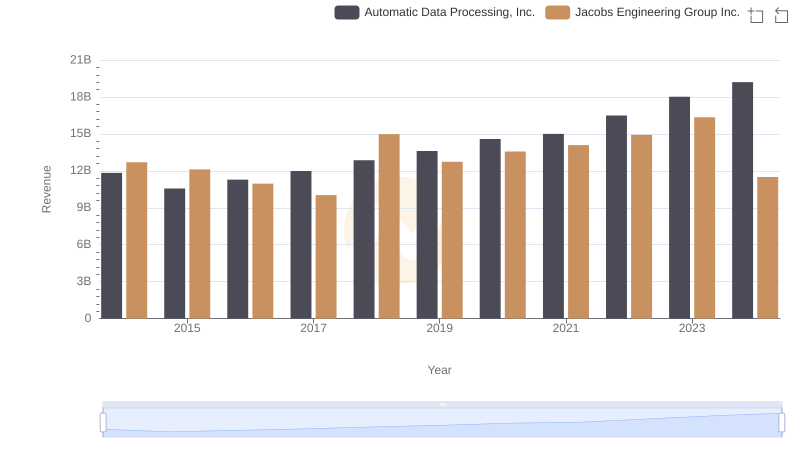
Automatic Data Processing, Inc. or Jacobs Engineering Group Inc.: Who Leads in Yearly Revenue?

Cost Insights: Breaking Down Automatic Data Processing, Inc. and TransUnion's Expenses
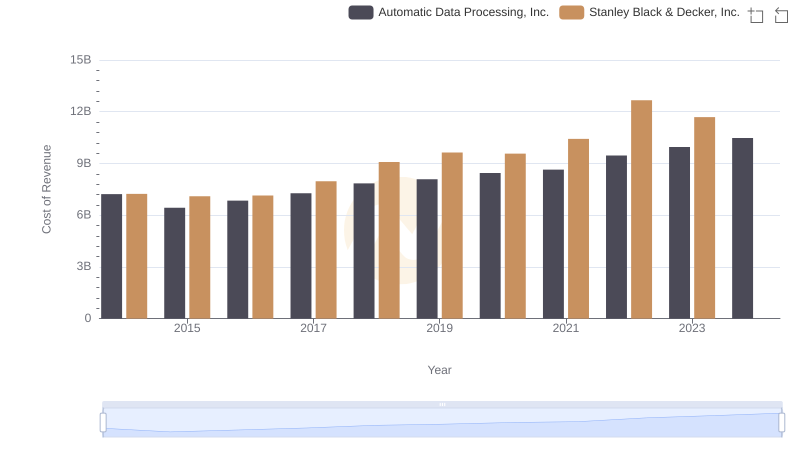
Automatic Data Processing, Inc. vs Stanley Black & Decker, Inc.: Efficiency in Cost of Revenue Explored
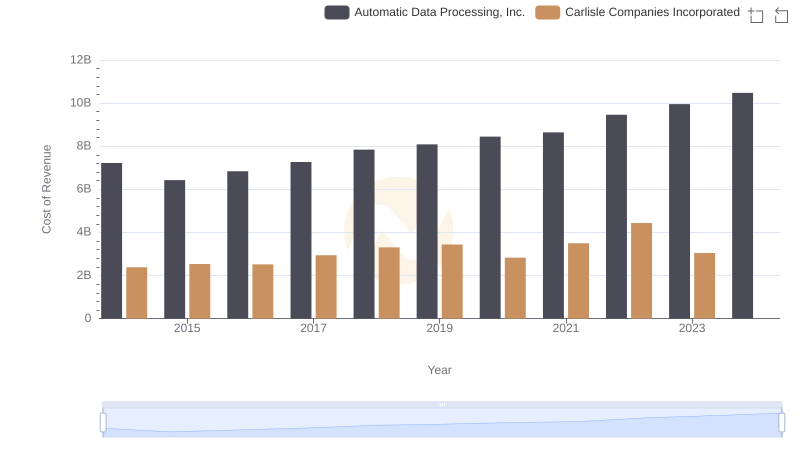
Cost of Revenue: Key Insights for Automatic Data Processing, Inc. and Carlisle Companies Incorporated
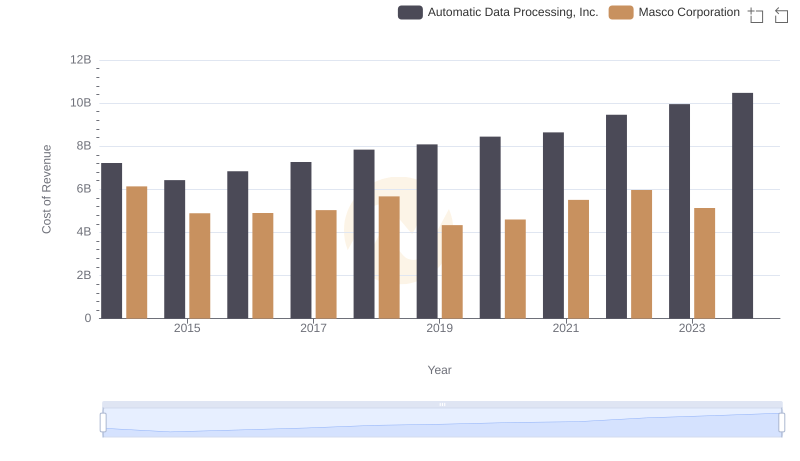
Cost of Revenue Trends: Automatic Data Processing, Inc. vs Masco Corporation
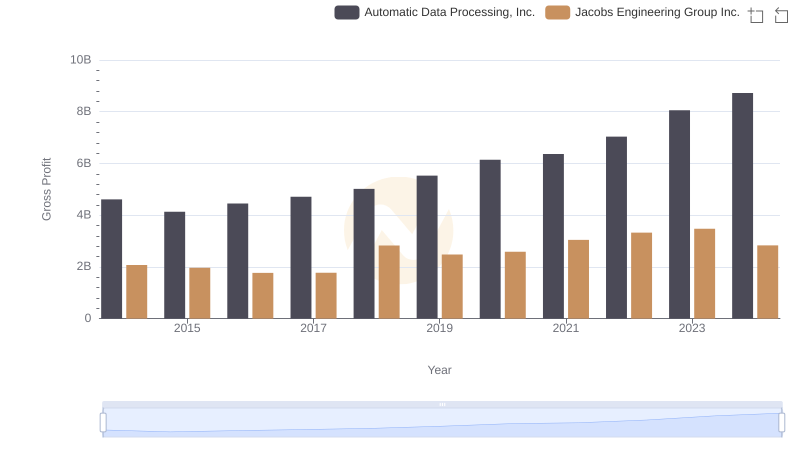
Automatic Data Processing, Inc. vs Jacobs Engineering Group Inc.: A Gross Profit Performance Breakdown
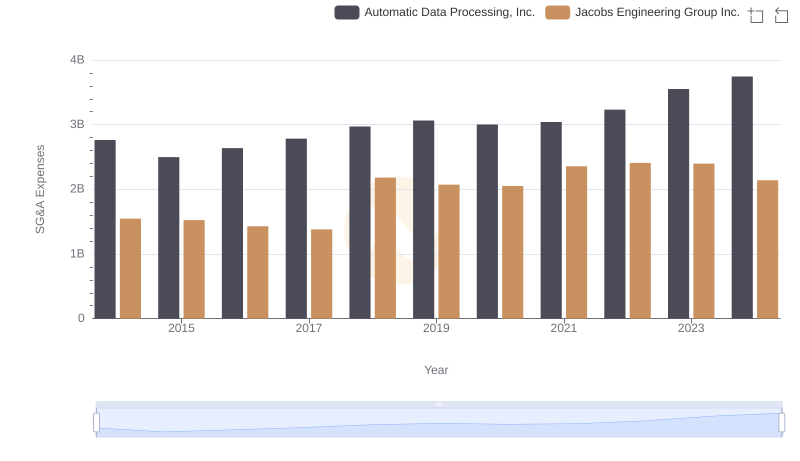
Who Optimizes SG&A Costs Better? Automatic Data Processing, Inc. or Jacobs Engineering Group Inc.
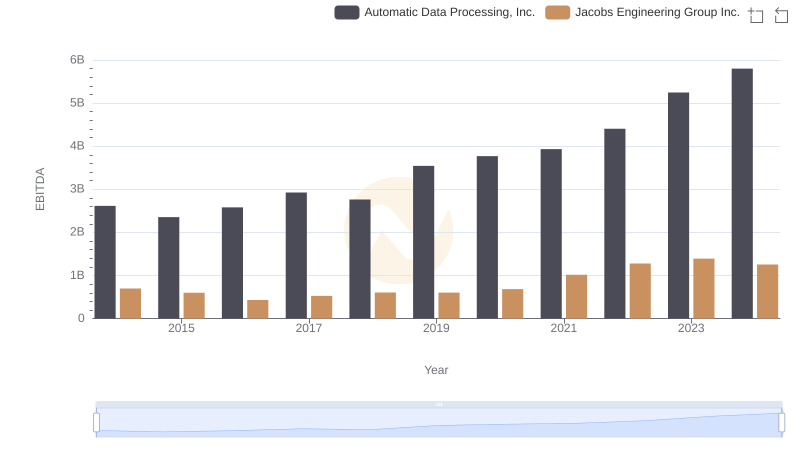
EBITDA Metrics Evaluated: Automatic Data Processing, Inc. vs Jacobs Engineering Group Inc.