| __timestamp | AerCap Holdings N.V. | Automatic Data Processing, Inc. |
|---|---|---|
| Wednesday, January 1, 2014 | 2997442000 | 2616900000 |
| Thursday, January 1, 2015 | 4313510000 | 2355100000 |
| Friday, January 1, 2016 | 4101801000 | 2579500000 |
| Sunday, January 1, 2017 | 4061381000 | 2927200000 |
| Monday, January 1, 2018 | 2874193000 | 2762900000 |
| Tuesday, January 1, 2019 | 3157061000 | 3544500000 |
| Wednesday, January 1, 2020 | 4028661000 | 3769700000 |
| Friday, January 1, 2021 | 3192341000 | 3931600000 |
| Saturday, January 1, 2022 | 6911148000 | 4405500000 |
| Sunday, January 1, 2023 | 4547656000 | 5244600000 |
| Monday, January 1, 2024 | 5800000000 |
Cracking the code
In the ever-evolving landscape of global business, understanding the financial health of industry giants is crucial. This analysis delves into the EBITDA performance of Automatic Data Processing, Inc. (ADP) and AerCap Holdings N.V. over the past decade. From 2014 to 2023, AerCap Holdings N.V. demonstrated a robust growth trajectory, peaking in 2022 with a staggering 70% increase from its 2014 figures. Meanwhile, ADP showcased consistent growth, culminating in a 123% rise in EBITDA by 2023 compared to 2014. Notably, 2022 marked a significant year for both companies, with AerCap achieving its highest EBITDA, while ADP continued its upward trend. However, data for AerCap in 2024 remains elusive, leaving room for speculation. This comparative analysis not only highlights the resilience and strategic prowess of these corporations but also underscores the dynamic nature of the financial markets.

Revenue Showdown: Automatic Data Processing, Inc. vs AerCap Holdings N.V.
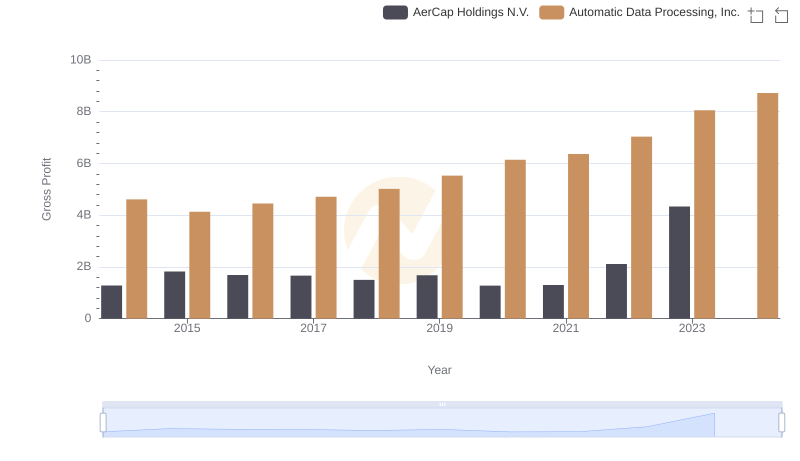
Key Insights on Gross Profit: Automatic Data Processing, Inc. vs AerCap Holdings N.V.

Breaking Down SG&A Expenses: Automatic Data Processing, Inc. vs AerCap Holdings N.V.
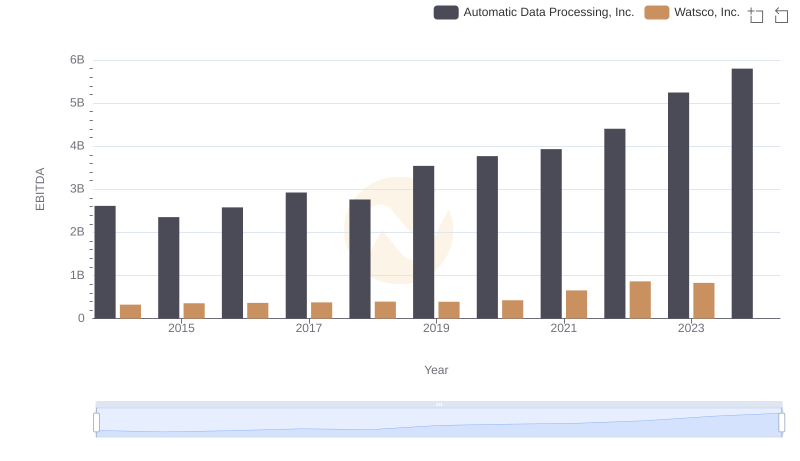
EBITDA Metrics Evaluated: Automatic Data Processing, Inc. vs Watsco, Inc.
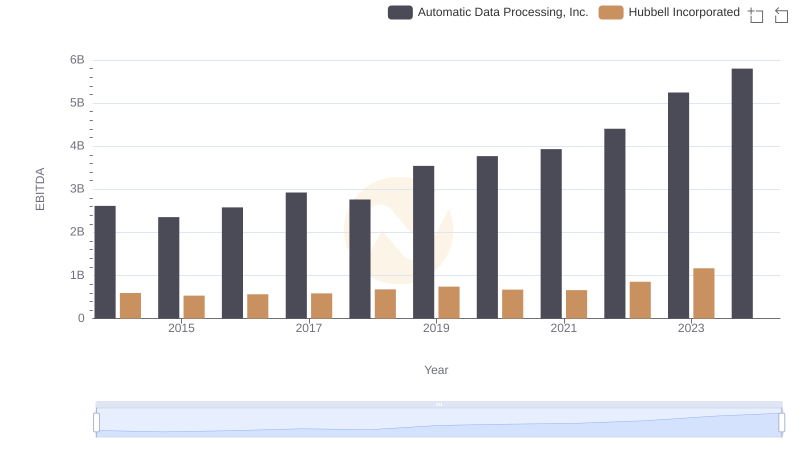
EBITDA Performance Review: Automatic Data Processing, Inc. vs Hubbell Incorporated
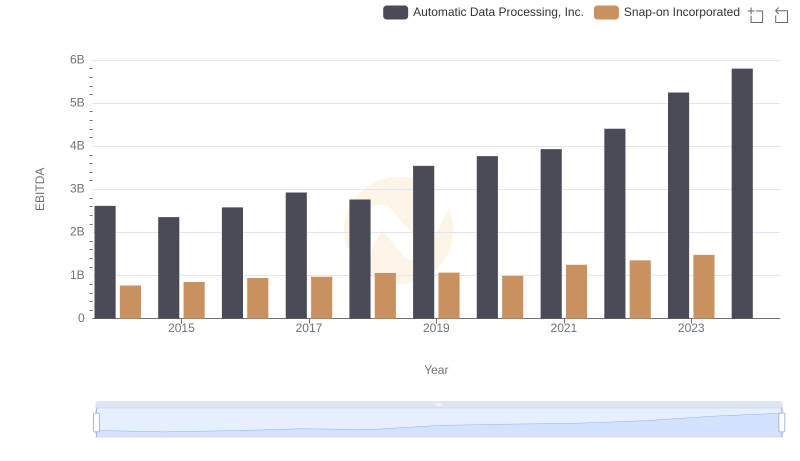
Professional EBITDA Benchmarking: Automatic Data Processing, Inc. vs Snap-on Incorporated
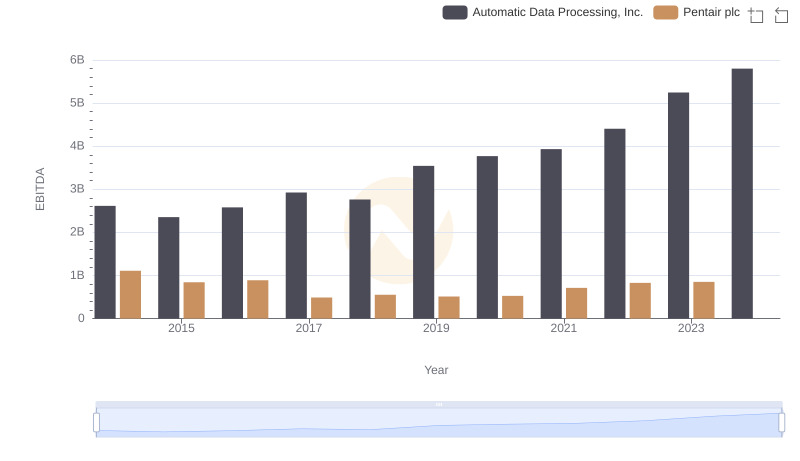
Comprehensive EBITDA Comparison: Automatic Data Processing, Inc. vs Pentair plc
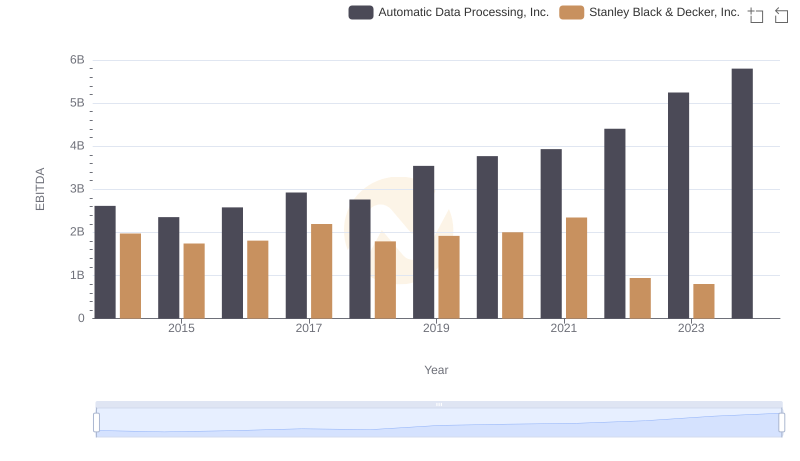
A Side-by-Side Analysis of EBITDA: Automatic Data Processing, Inc. and Stanley Black & Decker, Inc.
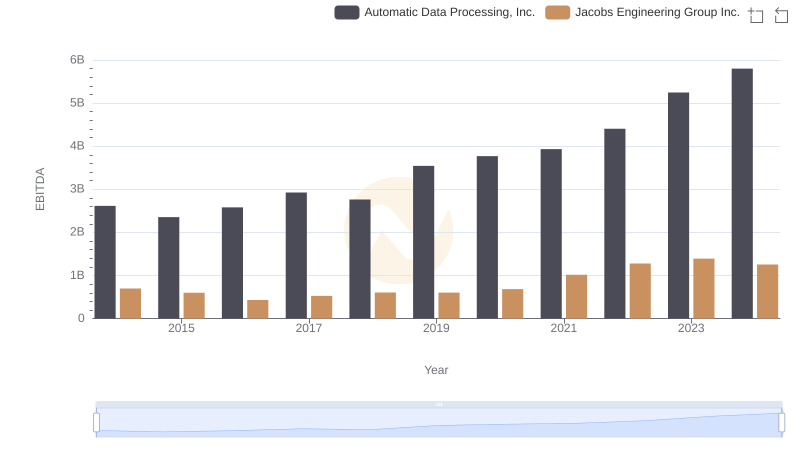
EBITDA Metrics Evaluated: Automatic Data Processing, Inc. vs Jacobs Engineering Group Inc.
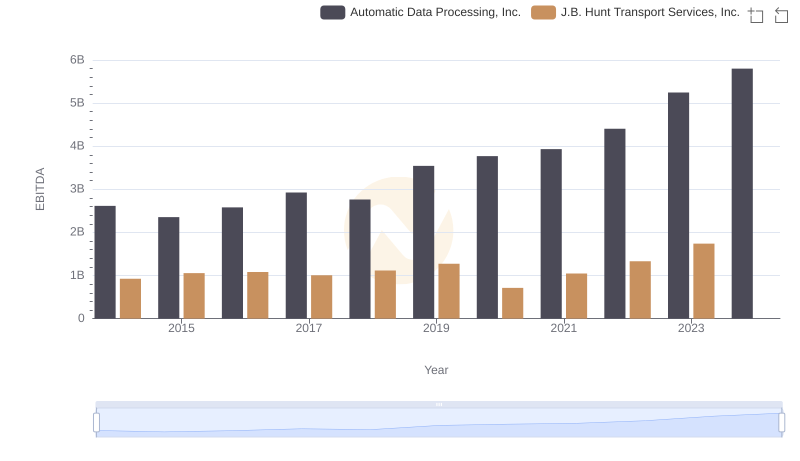
A Professional Review of EBITDA: Automatic Data Processing, Inc. Compared to J.B. Hunt Transport Services, Inc.
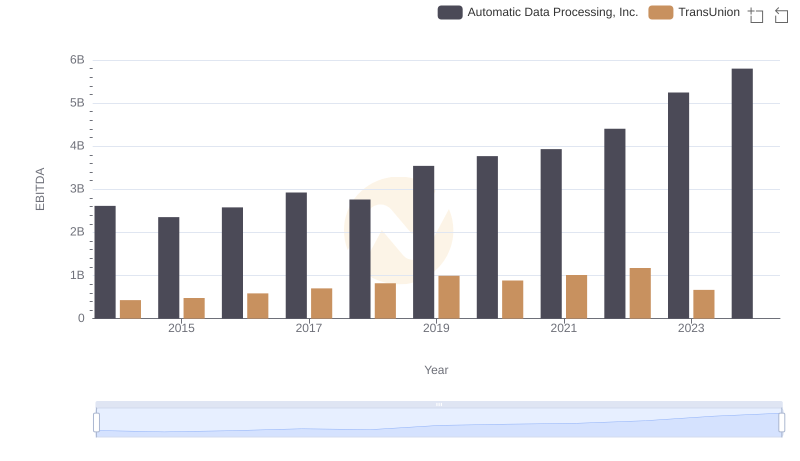
Automatic Data Processing, Inc. vs TransUnion: In-Depth EBITDA Performance Comparison