| __timestamp | HEICO Corporation | Rockwell Automation, Inc. |
|---|---|---|
| Wednesday, January 1, 2014 | 251213000 | 1346000000 |
| Thursday, January 1, 2015 | 276790000 | 1359100000 |
| Friday, January 1, 2016 | 325022000 | 1200700000 |
| Sunday, January 1, 2017 | 372581000 | 1258400000 |
| Monday, January 1, 2018 | 452287000 | 1568400000 |
| Tuesday, January 1, 2019 | 542136000 | 1150200000 |
| Wednesday, January 1, 2020 | 465714000 | 1410200000 |
| Friday, January 1, 2021 | 486243000 | 1808300000 |
| Saturday, January 1, 2022 | 592709000 | 1432100000 |
| Sunday, January 1, 2023 | 756767000 | 1990700000 |
| Monday, January 1, 2024 | 824455000 | 1567500000 |
Unlocking the unknown
In the ever-evolving landscape of industrial automation and aerospace technology, Rockwell Automation, Inc. and HEICO Corporation stand as titans. From 2014 to 2024, Rockwell Automation consistently outperformed HEICO in terms of EBITDA, with an average of $1.46 billion annually, compared to HEICO's $486 million. However, the growth trajectory tells a different story. HEICO's EBITDA surged by approximately 228% over the decade, while Rockwell's increased by a modest 16%. This stark contrast highlights HEICO's aggressive expansion strategy, particularly evident in 2023, where its EBITDA peaked at $756 million, a 28% increase from the previous year. Meanwhile, Rockwell's EBITDA reached its zenith in 2023 at $1.99 billion, before a slight dip in 2024. This analysis underscores the dynamic shifts in market strategies and growth potential within these industries.
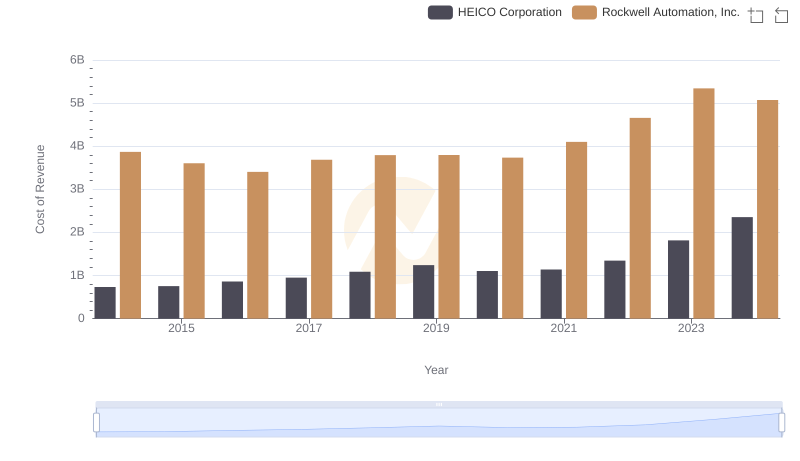
Analyzing Cost of Revenue: Rockwell Automation, Inc. and HEICO Corporation
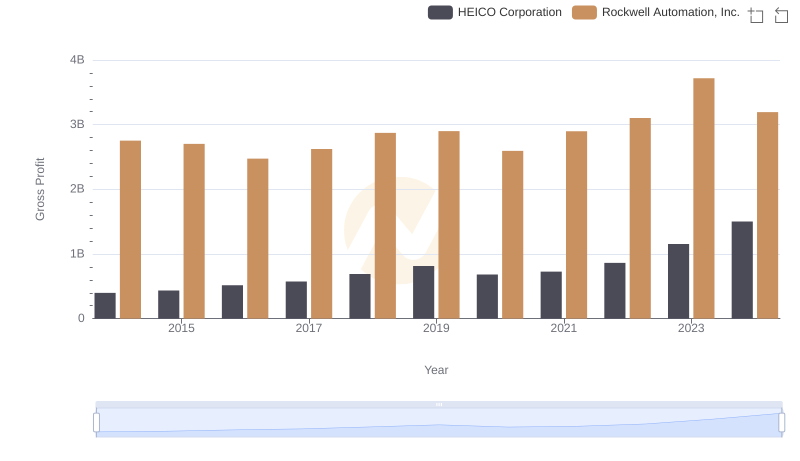
Gross Profit Analysis: Comparing Rockwell Automation, Inc. and HEICO Corporation
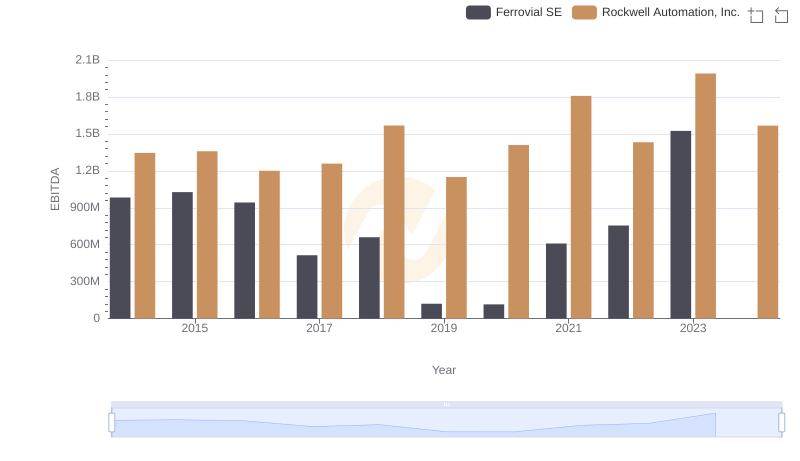
Rockwell Automation, Inc. vs Ferrovial SE: In-Depth EBITDA Performance Comparison
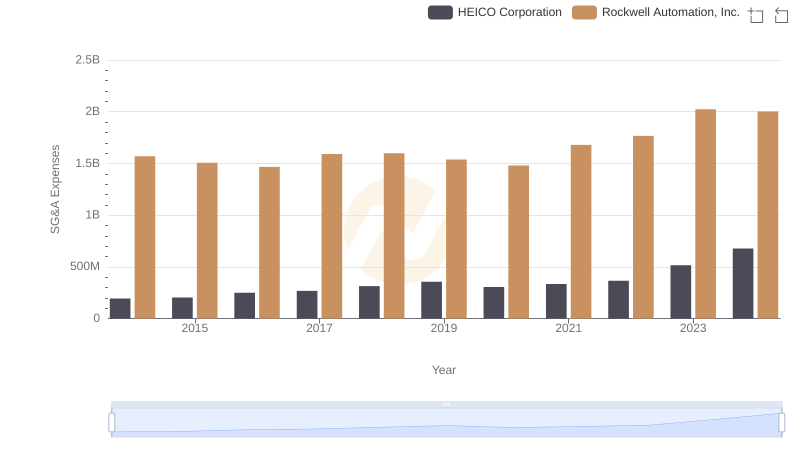
Comparing SG&A Expenses: Rockwell Automation, Inc. vs HEICO Corporation Trends and Insights
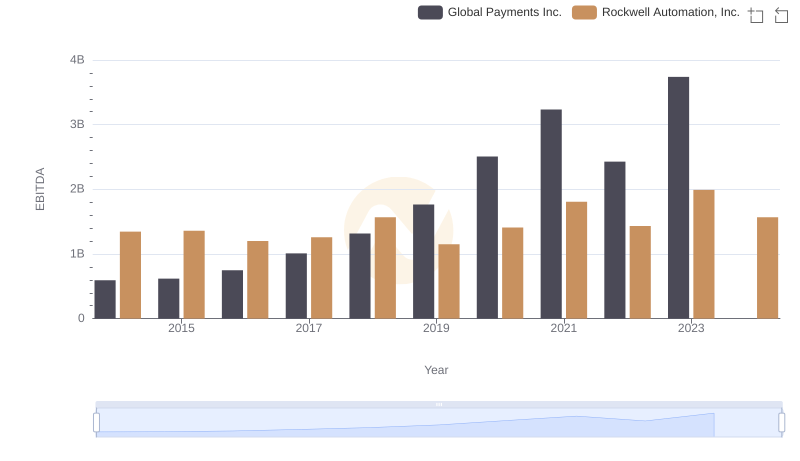
Rockwell Automation, Inc. vs Global Payments Inc.: In-Depth EBITDA Performance Comparison
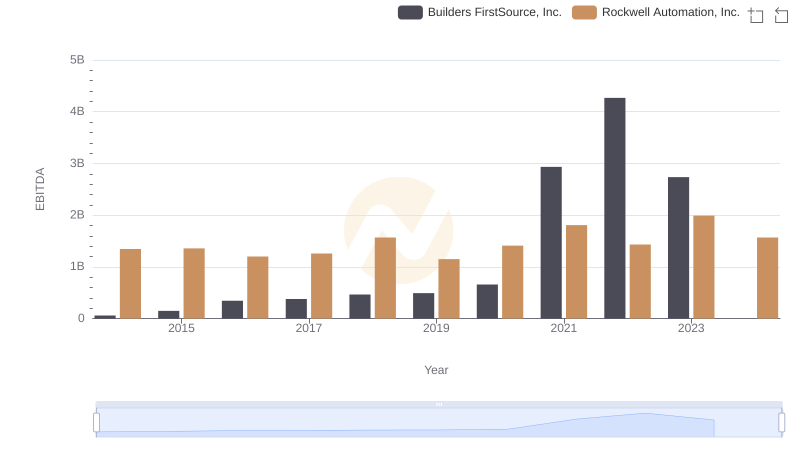
EBITDA Analysis: Evaluating Rockwell Automation, Inc. Against Builders FirstSource, Inc.
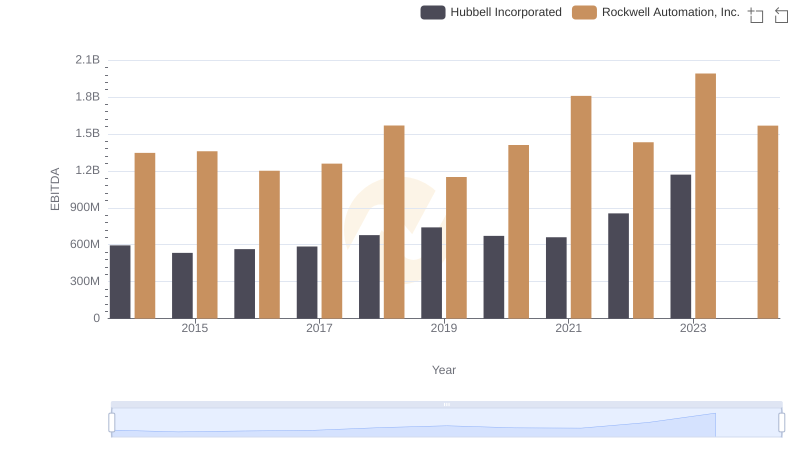
A Professional Review of EBITDA: Rockwell Automation, Inc. Compared to Hubbell Incorporated
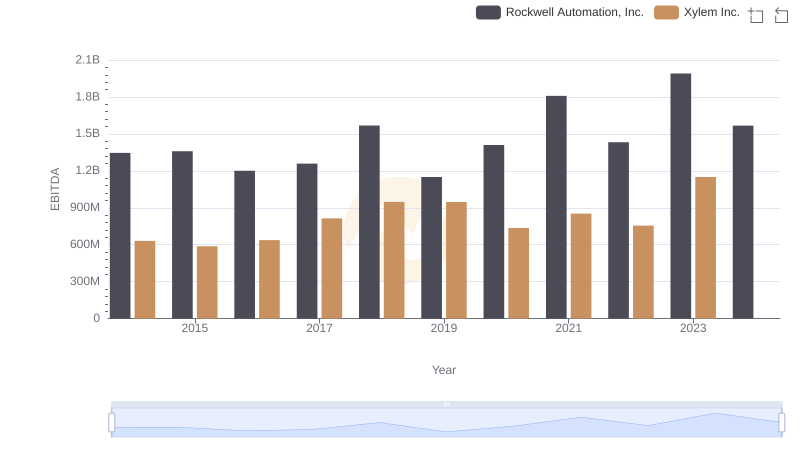
Professional EBITDA Benchmarking: Rockwell Automation, Inc. vs Xylem Inc.
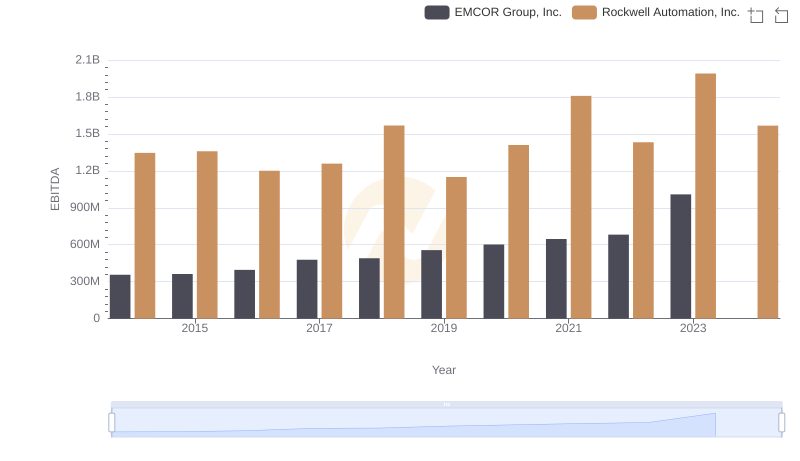
Rockwell Automation, Inc. and EMCOR Group, Inc.: A Detailed Examination of EBITDA Performance
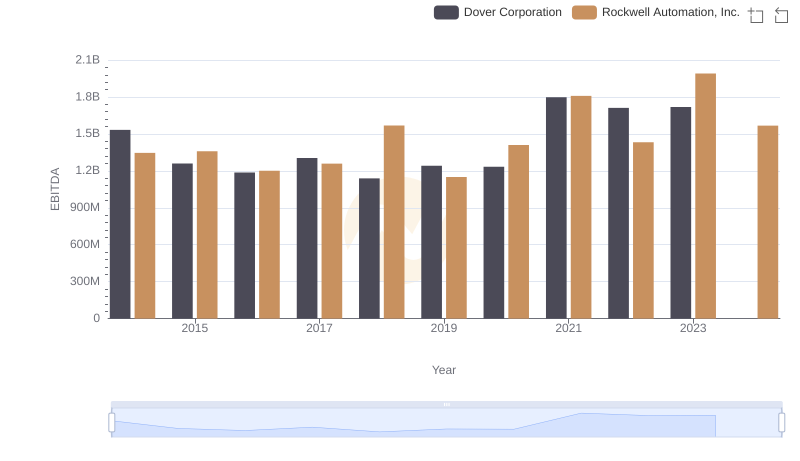
EBITDA Performance Review: Rockwell Automation, Inc. vs Dover Corporation
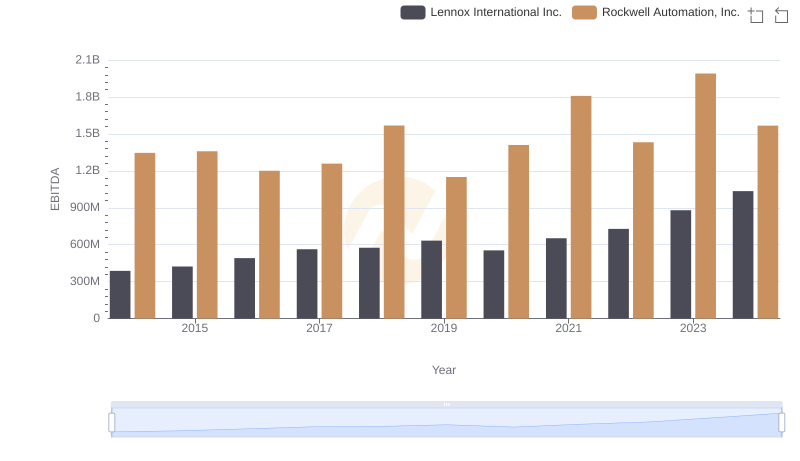
EBITDA Performance Review: Rockwell Automation, Inc. vs Lennox International Inc.