| __timestamp | Ferrovial SE | Rockwell Automation, Inc. |
|---|---|---|
| Wednesday, January 1, 2014 | 983000000 | 1346000000 |
| Thursday, January 1, 2015 | 1027000000 | 1359100000 |
| Friday, January 1, 2016 | 943000000 | 1200700000 |
| Sunday, January 1, 2017 | 515000000 | 1258400000 |
| Monday, January 1, 2018 | 661000000 | 1568400000 |
| Tuesday, January 1, 2019 | 121000000 | 1150200000 |
| Wednesday, January 1, 2020 | 116000000 | 1410200000 |
| Friday, January 1, 2021 | 610000000 | 1808300000 |
| Saturday, January 1, 2022 | 756000000 | 1432100000 |
| Sunday, January 1, 2023 | 1524000000 | 1990700000 |
| Monday, January 1, 2024 | 1567500000 |
Igniting the spark of knowledge
In the ever-evolving landscape of global industry, Rockwell Automation, Inc. and Ferrovial SE stand as titans in their respective fields. Over the past decade, these companies have showcased remarkable EBITDA performance, reflecting their strategic prowess and market adaptability.
Rockwell Automation has consistently demonstrated robust growth, with its EBITDA peaking in 2023 at nearly 2 billion USD, marking a 48% increase from 2014. This steady rise underscores its commitment to innovation and efficiency in automation solutions.
Conversely, Ferrovial SE's EBITDA journey has been more volatile. Despite a dip in 2019, the company rebounded impressively, achieving a 55% increase by 2023 compared to 2014. This resilience highlights its strategic agility in the infrastructure sector.
As we look to the future, these trends offer valuable insights into the dynamic interplay of industry leaders.
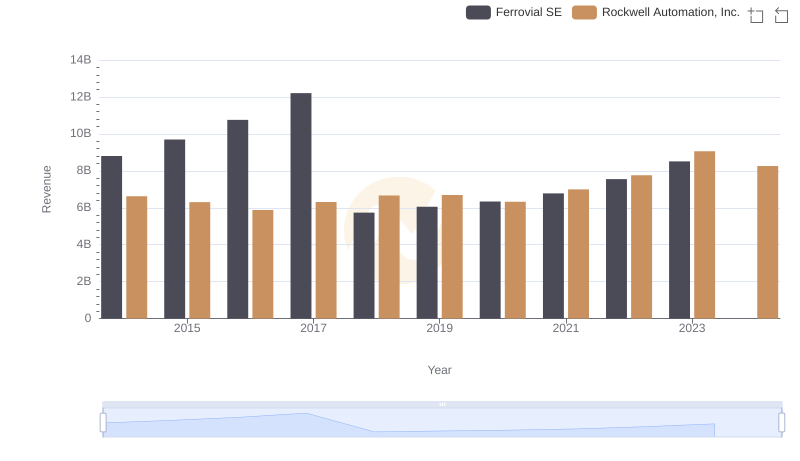
Breaking Down Revenue Trends: Rockwell Automation, Inc. vs Ferrovial SE
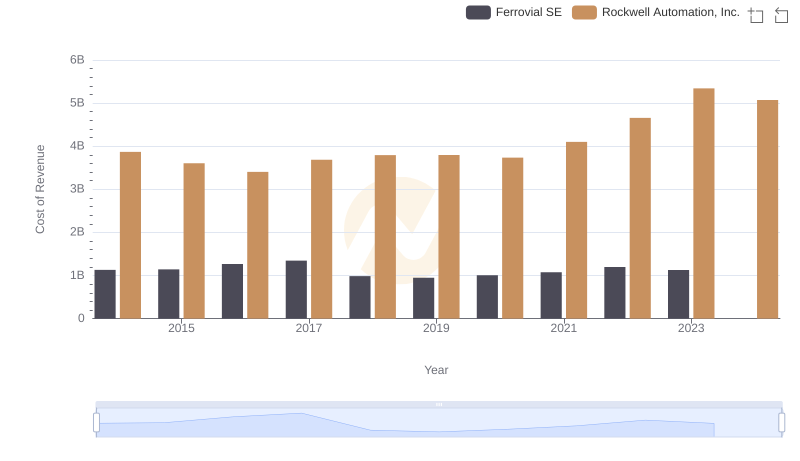
Comparing Cost of Revenue Efficiency: Rockwell Automation, Inc. vs Ferrovial SE
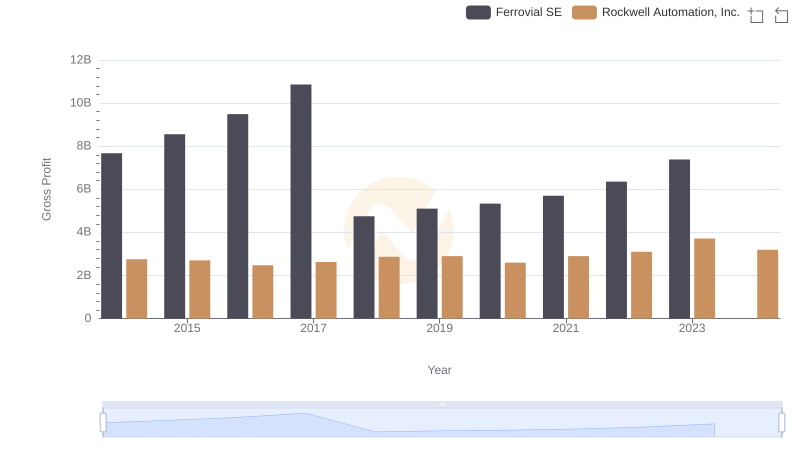
Key Insights on Gross Profit: Rockwell Automation, Inc. vs Ferrovial SE
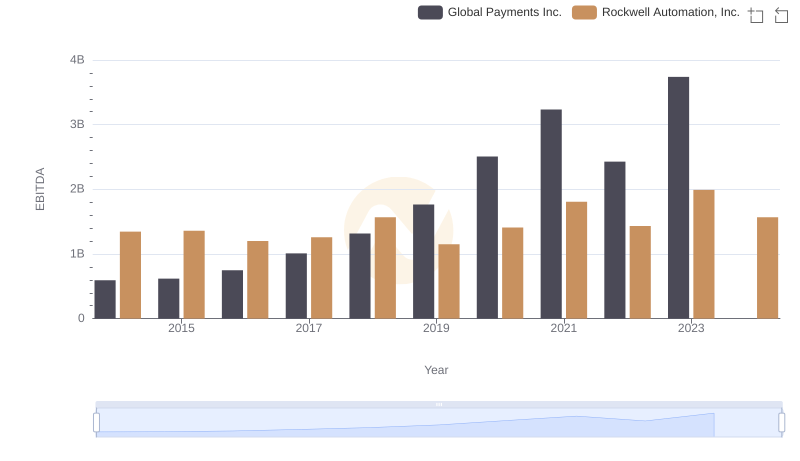
Rockwell Automation, Inc. vs Global Payments Inc.: In-Depth EBITDA Performance Comparison
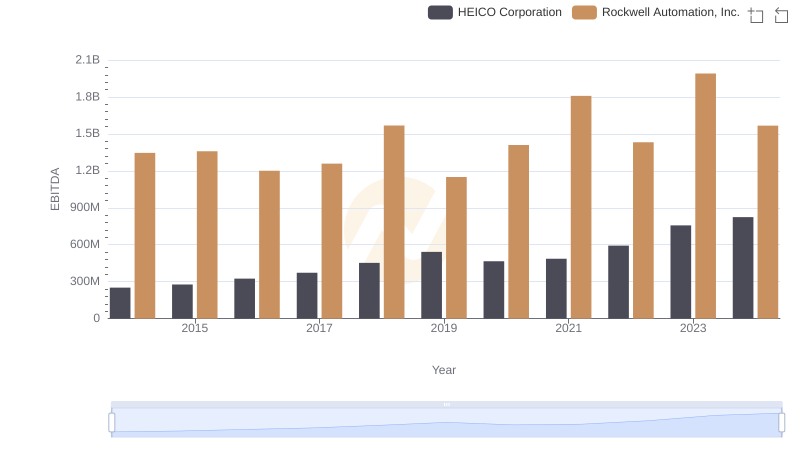
EBITDA Analysis: Evaluating Rockwell Automation, Inc. Against HEICO Corporation
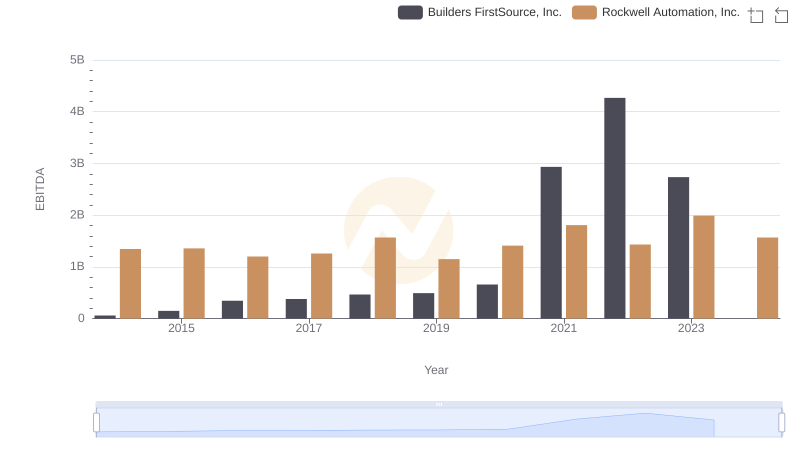
EBITDA Analysis: Evaluating Rockwell Automation, Inc. Against Builders FirstSource, Inc.
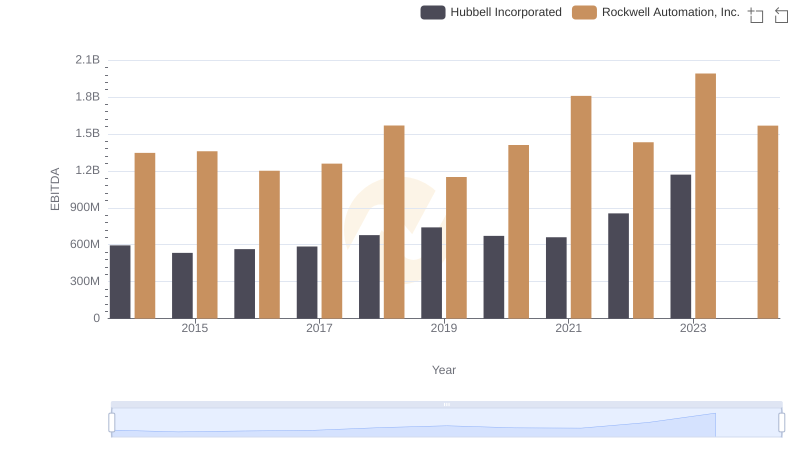
A Professional Review of EBITDA: Rockwell Automation, Inc. Compared to Hubbell Incorporated
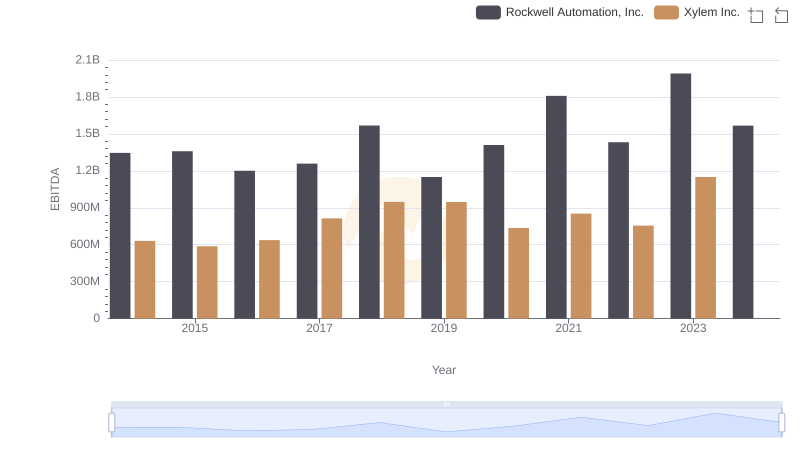
Professional EBITDA Benchmarking: Rockwell Automation, Inc. vs Xylem Inc.
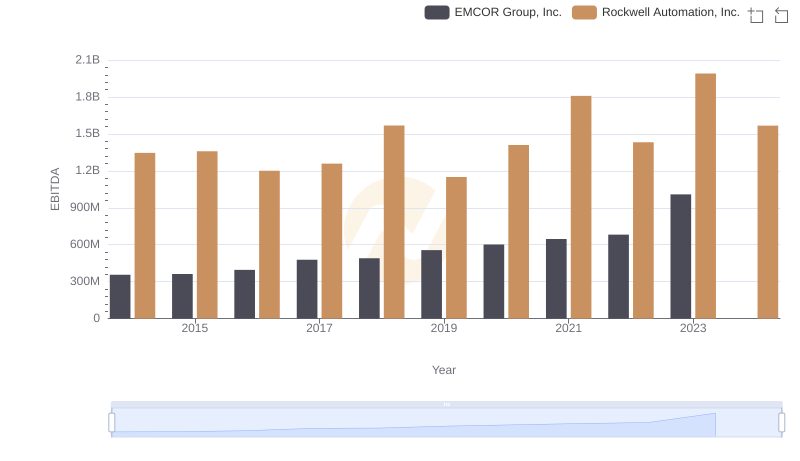
Rockwell Automation, Inc. and EMCOR Group, Inc.: A Detailed Examination of EBITDA Performance
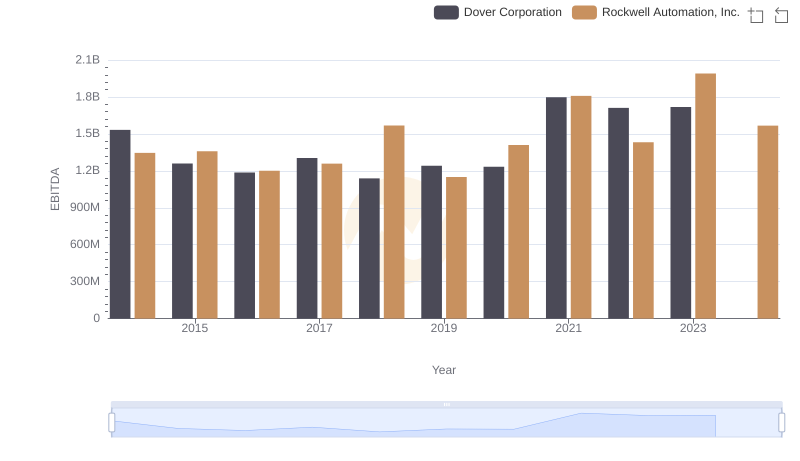
EBITDA Performance Review: Rockwell Automation, Inc. vs Dover Corporation
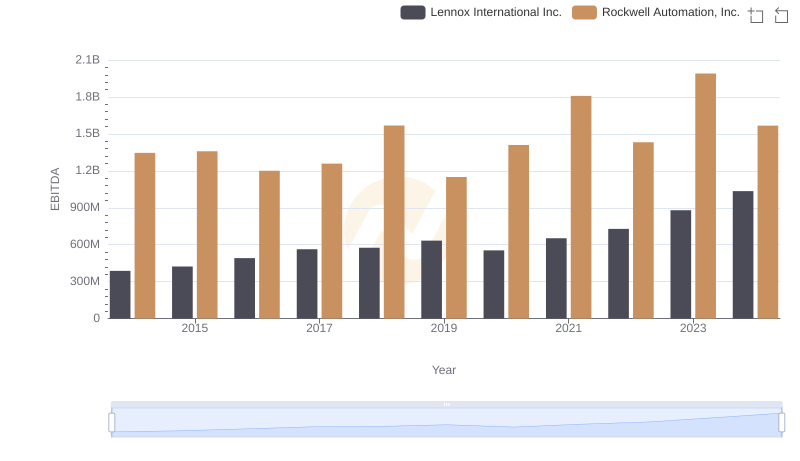
EBITDA Performance Review: Rockwell Automation, Inc. vs Lennox International Inc.
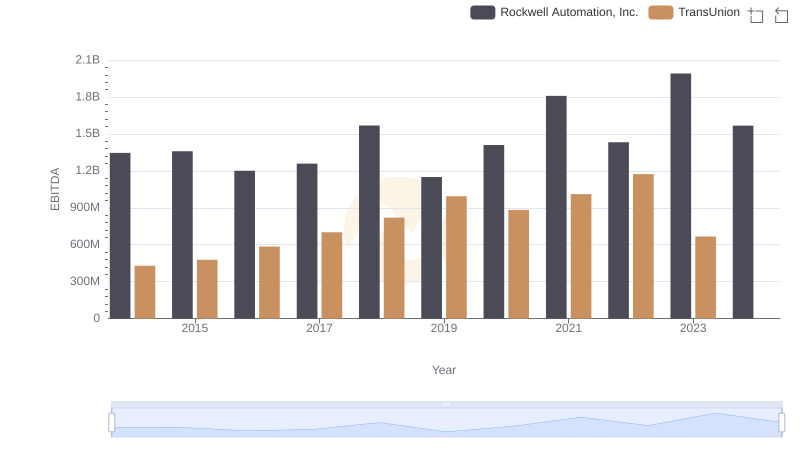
Comparative EBITDA Analysis: Rockwell Automation, Inc. vs TransUnion