| __timestamp | HEICO Corporation | Rockwell Automation, Inc. |
|---|---|---|
| Wednesday, January 1, 2014 | 733999000 | 3869600000 |
| Thursday, January 1, 2015 | 754469000 | 3604800000 |
| Friday, January 1, 2016 | 860766000 | 3404000000 |
| Sunday, January 1, 2017 | 950088000 | 3687100000 |
| Monday, January 1, 2018 | 1087006000 | 3793800000 |
| Tuesday, January 1, 2019 | 1241807000 | 3794700000 |
| Wednesday, January 1, 2020 | 1104882000 | 3734600000 |
| Friday, January 1, 2021 | 1138259000 | 4099700000 |
| Saturday, January 1, 2022 | 1345563000 | 4658400000 |
| Sunday, January 1, 2023 | 1814617000 | 5341000000 |
| Monday, January 1, 2024 | 2355943000 | 5070800000 |
Infusing magic into the data realm
In the ever-evolving landscape of industrial automation and aerospace technology, Rockwell Automation, Inc. and HEICO Corporation stand as titans. Over the past decade, from 2014 to 2024, these companies have demonstrated remarkable growth in their cost of revenue, a key indicator of operational scale and efficiency.
Rockwell Automation has seen a steady increase in its cost of revenue, peaking in 2023 with a 38% rise from 2014. This growth reflects its expanding footprint in the automation sector, driven by innovation and strategic acquisitions.
HEICO Corporation, a leader in aerospace and electronics, has experienced an even more dramatic surge. From 2014 to 2024, its cost of revenue skyrocketed by over 220%, underscoring its aggressive expansion and market penetration strategies.
This analysis highlights the dynamic nature of these industries and the strategic maneuvers of these companies to maintain their competitive edge.
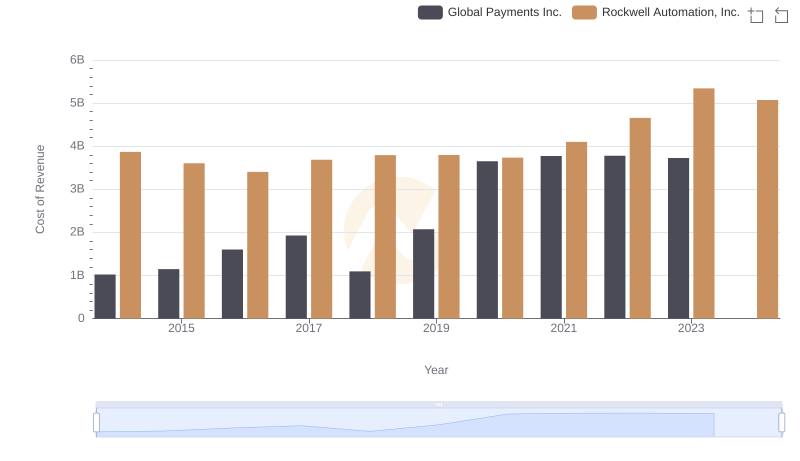
Rockwell Automation, Inc. vs Global Payments Inc.: Efficiency in Cost of Revenue Explored
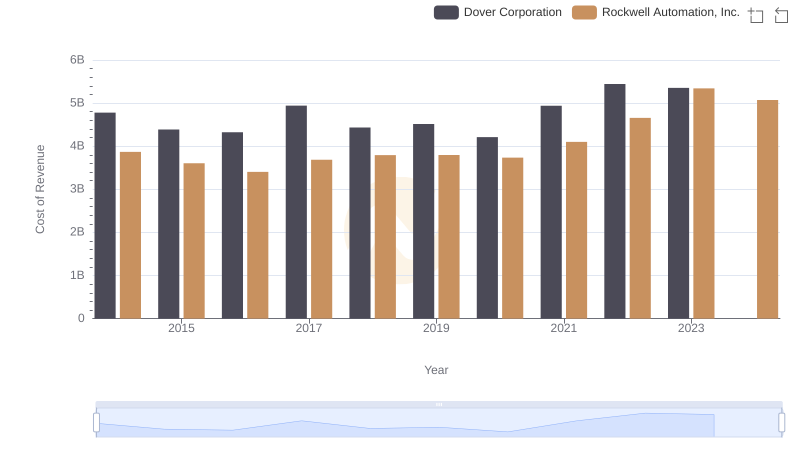
Analyzing Cost of Revenue: Rockwell Automation, Inc. and Dover Corporation
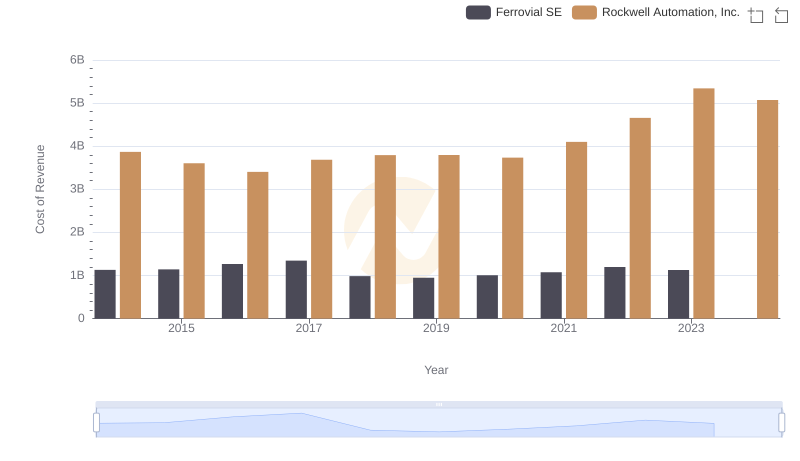
Comparing Cost of Revenue Efficiency: Rockwell Automation, Inc. vs Ferrovial SE
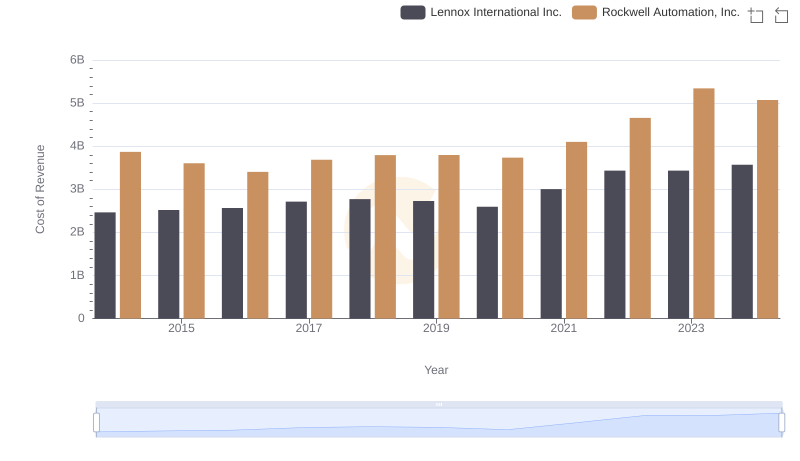
Cost of Revenue Trends: Rockwell Automation, Inc. vs Lennox International Inc.
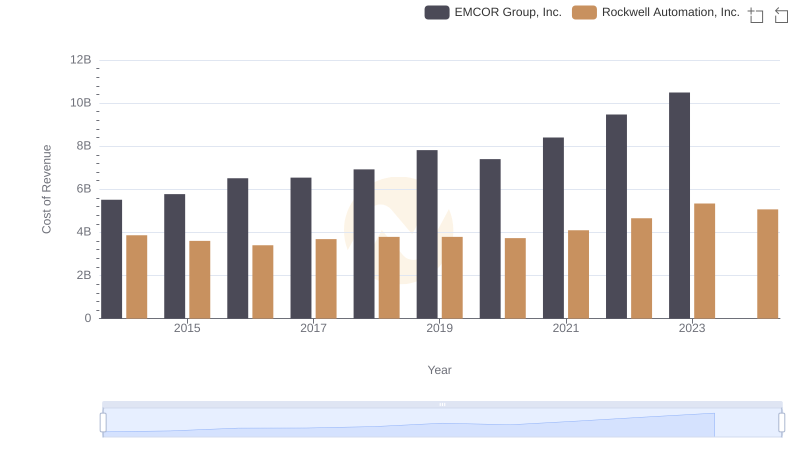
Cost of Revenue Comparison: Rockwell Automation, Inc. vs EMCOR Group, Inc.
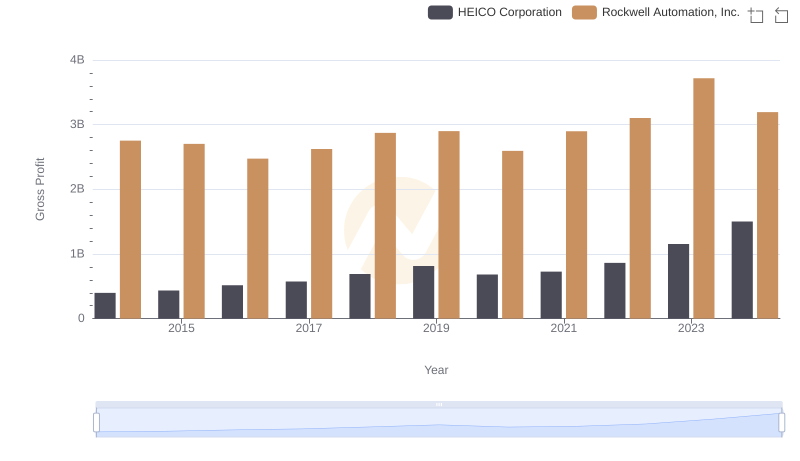
Gross Profit Analysis: Comparing Rockwell Automation, Inc. and HEICO Corporation
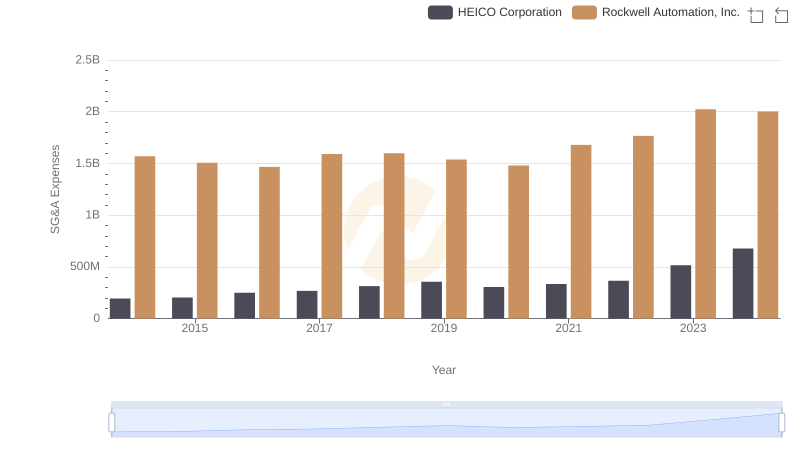
Comparing SG&A Expenses: Rockwell Automation, Inc. vs HEICO Corporation Trends and Insights
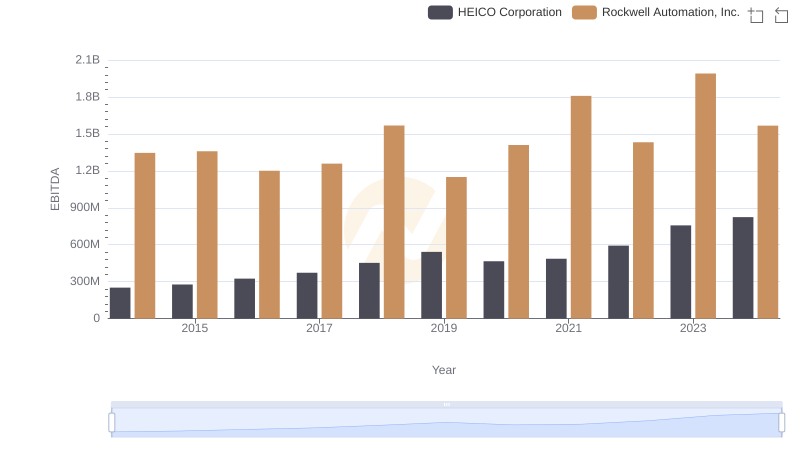
EBITDA Analysis: Evaluating Rockwell Automation, Inc. Against HEICO Corporation