| __timestamp | HEICO Corporation | Rockwell Automation, Inc. |
|---|---|---|
| Wednesday, January 1, 2014 | 194924000 | 1570100000 |
| Thursday, January 1, 2015 | 204523000 | 1506400000 |
| Friday, January 1, 2016 | 250147000 | 1467400000 |
| Sunday, January 1, 2017 | 268067000 | 1591500000 |
| Monday, January 1, 2018 | 314470000 | 1599000000 |
| Tuesday, January 1, 2019 | 356743000 | 1538500000 |
| Wednesday, January 1, 2020 | 305479000 | 1479800000 |
| Friday, January 1, 2021 | 334523000 | 1680000000 |
| Saturday, January 1, 2022 | 365915000 | 1766700000 |
| Sunday, January 1, 2023 | 516292000 | 2023700000 |
| Monday, January 1, 2024 | 677271000 | 2002600000 |
Data in motion
In the ever-evolving landscape of industrial automation and aerospace technology, understanding the financial dynamics of key players is crucial. Over the past decade, Rockwell Automation, Inc. and HEICO Corporation have showcased distinct trends in their Selling, General, and Administrative (SG&A) expenses. From 2014 to 2024, Rockwell Automation consistently reported higher SG&A expenses, peaking at approximately $2 billion in 2023. This represents a steady increase of about 29% from 2014. In contrast, HEICO Corporation's SG&A expenses surged by an impressive 247% over the same period, reaching nearly $678 million in 2024. This stark difference highlights Rockwell's larger scale of operations, while HEICO's rapid growth underscores its expanding market footprint. These insights provide a window into the strategic priorities and operational efficiencies of these industry giants, offering valuable lessons for investors and competitors alike.
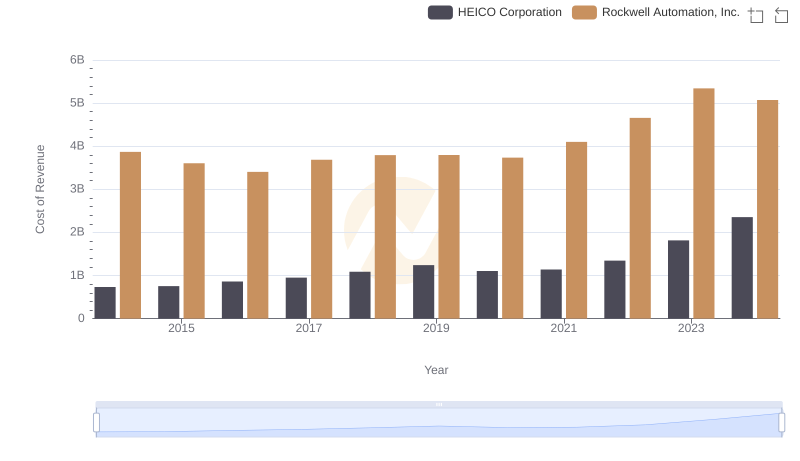
Analyzing Cost of Revenue: Rockwell Automation, Inc. and HEICO Corporation
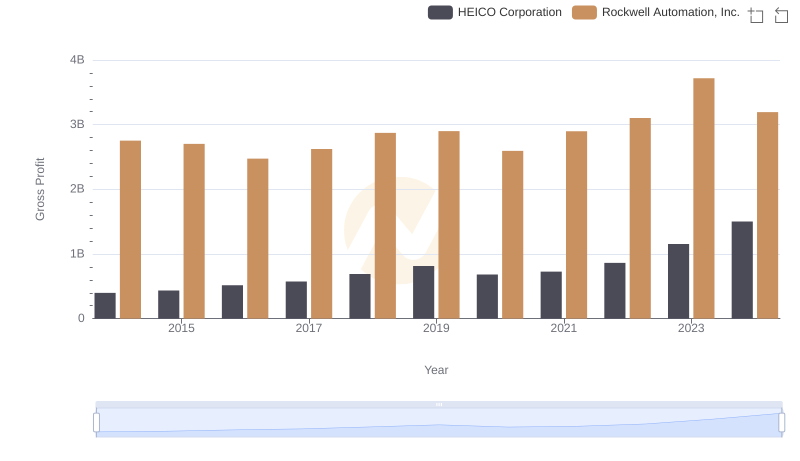
Gross Profit Analysis: Comparing Rockwell Automation, Inc. and HEICO Corporation
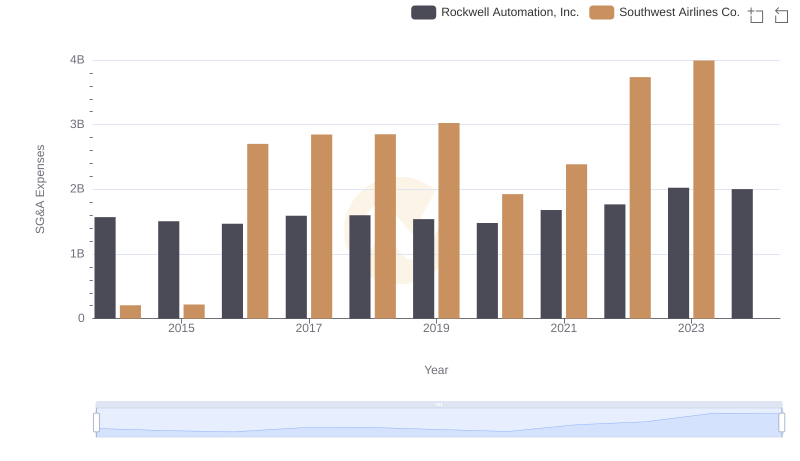
Rockwell Automation, Inc. and Southwest Airlines Co.: SG&A Spending Patterns Compared
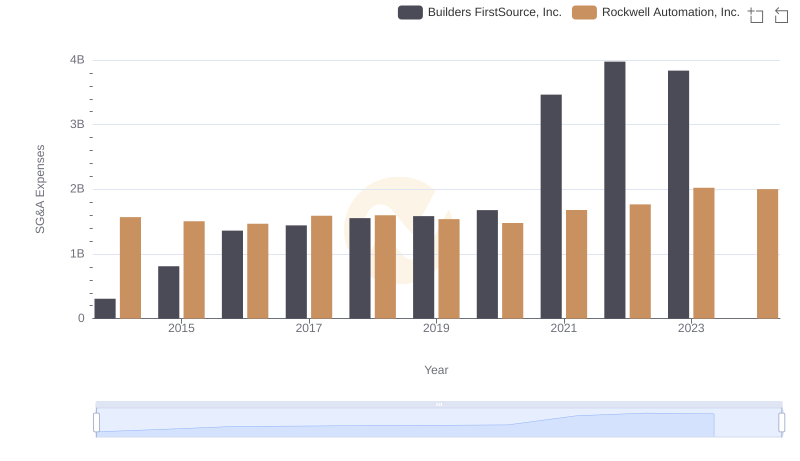
Operational Costs Compared: SG&A Analysis of Rockwell Automation, Inc. and Builders FirstSource, Inc.
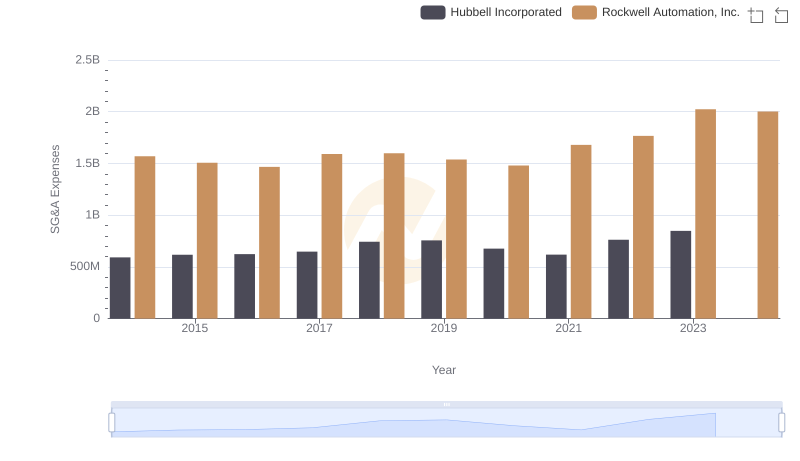
Operational Costs Compared: SG&A Analysis of Rockwell Automation, Inc. and Hubbell Incorporated
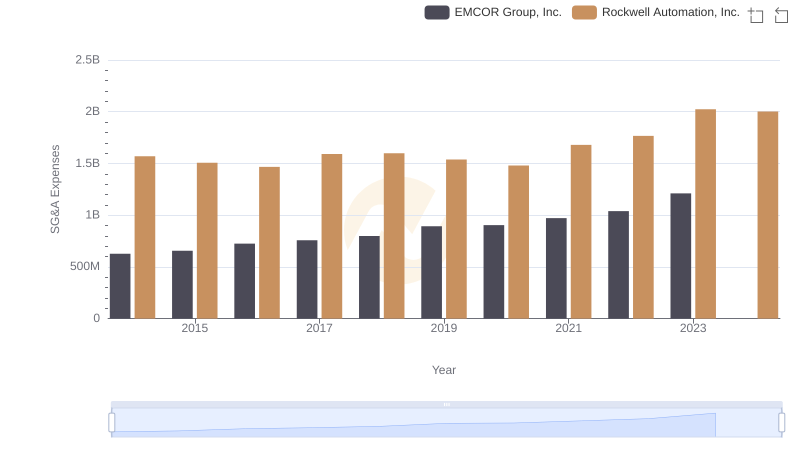
Comparing SG&A Expenses: Rockwell Automation, Inc. vs EMCOR Group, Inc. Trends and Insights
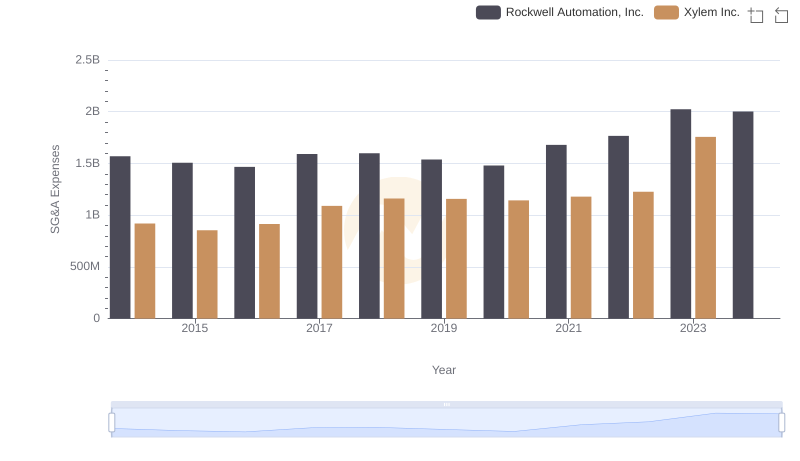
Who Optimizes SG&A Costs Better? Rockwell Automation, Inc. or Xylem Inc.
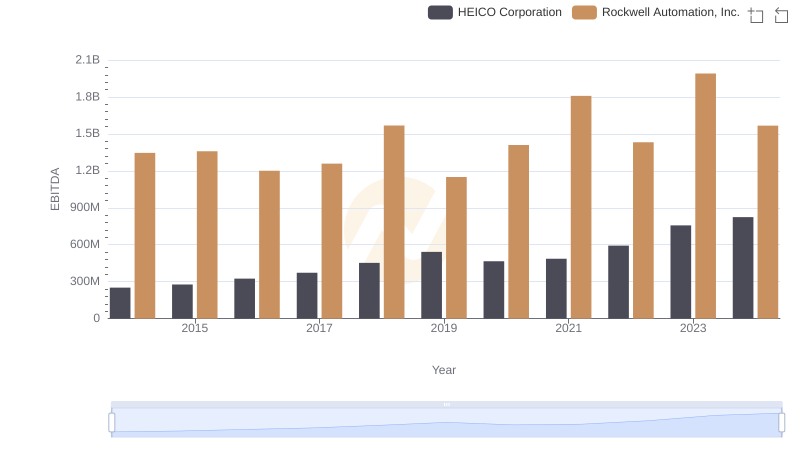
EBITDA Analysis: Evaluating Rockwell Automation, Inc. Against HEICO Corporation
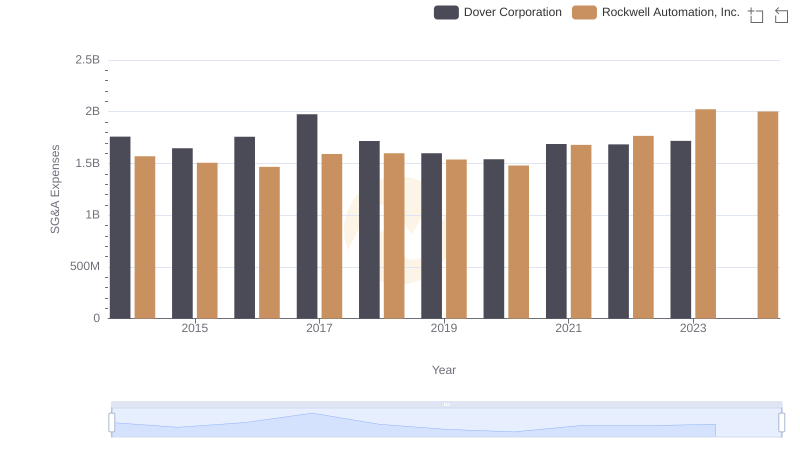
Cost Management Insights: SG&A Expenses for Rockwell Automation, Inc. and Dover Corporation
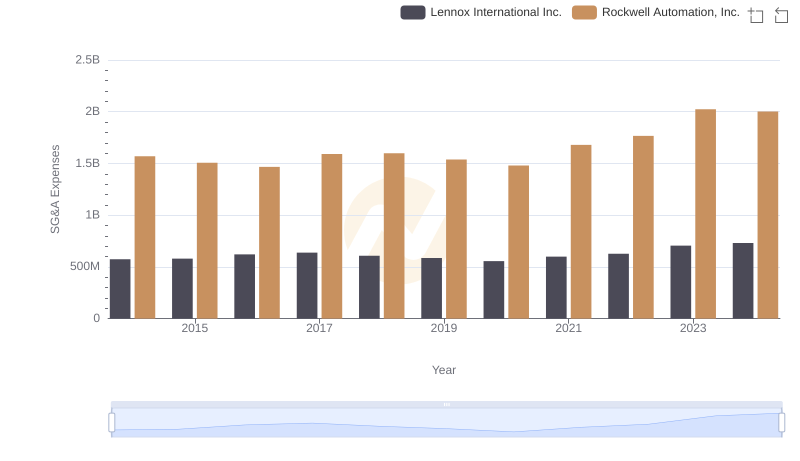
Cost Management Insights: SG&A Expenses for Rockwell Automation, Inc. and Lennox International Inc.