| __timestamp | HEICO Corporation | Rockwell Automation, Inc. |
|---|---|---|
| Wednesday, January 1, 2014 | 398312000 | 2753900000 |
| Thursday, January 1, 2015 | 434179000 | 2703100000 |
| Friday, January 1, 2016 | 515492000 | 2475500000 |
| Sunday, January 1, 2017 | 574725000 | 2624200000 |
| Monday, January 1, 2018 | 690715000 | 2872200000 |
| Tuesday, January 1, 2019 | 813840000 | 2900100000 |
| Wednesday, January 1, 2020 | 682127000 | 2595200000 |
| Friday, January 1, 2021 | 727423000 | 2897700000 |
| Saturday, January 1, 2022 | 862759000 | 3102000000 |
| Sunday, January 1, 2023 | 1153488000 | 3717000000 |
| Monday, January 1, 2024 | 1501726000 | 3193400000 |
Data in motion
In the competitive landscape of industrial automation and aerospace, Rockwell Automation, Inc. and HEICO Corporation have carved distinct paths. Over the past decade, Rockwell Automation has consistently outperformed HEICO in terms of gross profit, boasting figures that are approximately three to four times higher. However, the growth trajectory tells a different story. Since 2014, HEICO's gross profit has surged by nearly 280%, from $398 million to an impressive $1.5 billion in 2024. In contrast, Rockwell's growth, while substantial, has been more modest, with a 16% increase over the same period. This divergence highlights HEICO's aggressive expansion strategy, particularly in the aerospace sector, while Rockwell maintains its stronghold in industrial automation. As we look to the future, these trends suggest a dynamic shift in market leadership, with HEICO rapidly closing the gap.
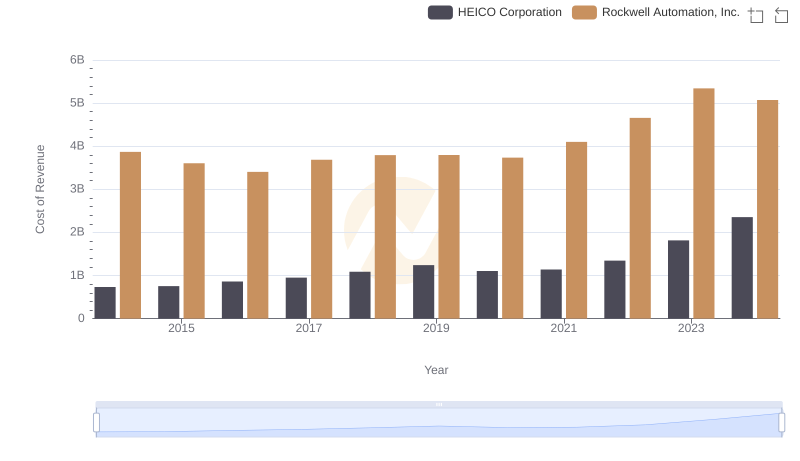
Analyzing Cost of Revenue: Rockwell Automation, Inc. and HEICO Corporation
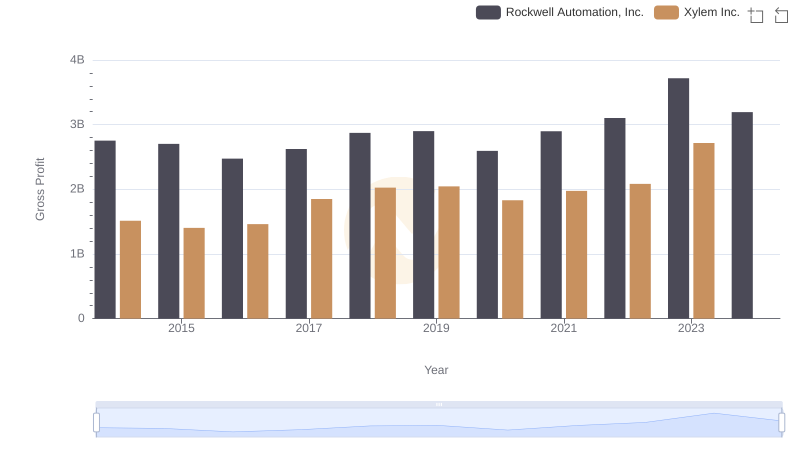
Gross Profit Comparison: Rockwell Automation, Inc. and Xylem Inc. Trends
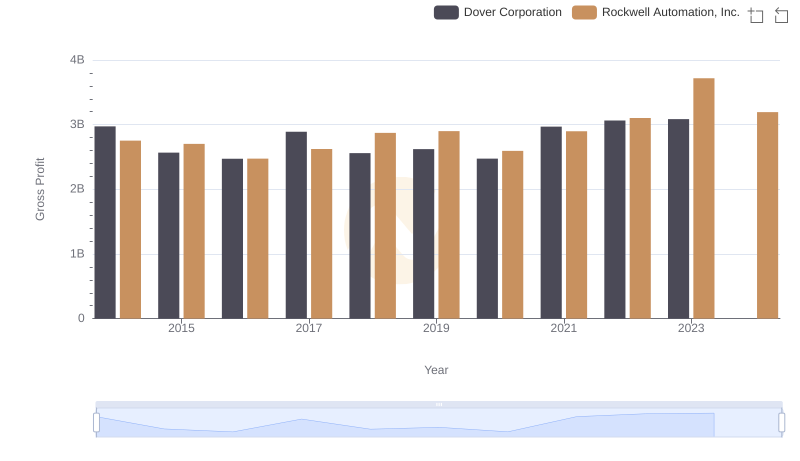
Gross Profit Analysis: Comparing Rockwell Automation, Inc. and Dover Corporation
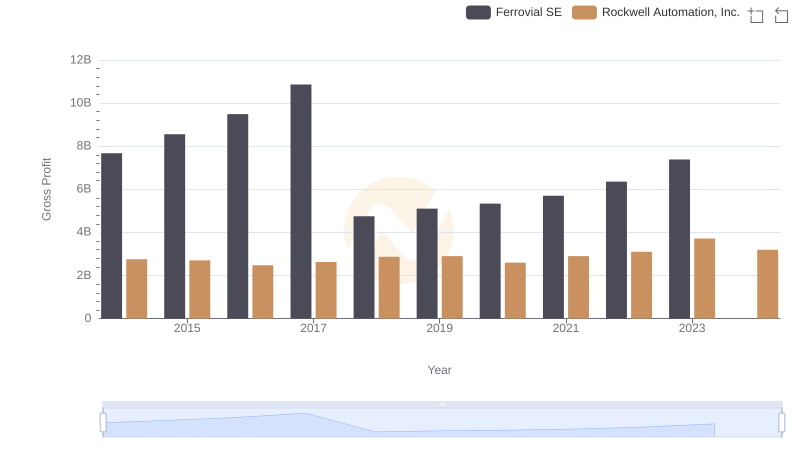
Key Insights on Gross Profit: Rockwell Automation, Inc. vs Ferrovial SE
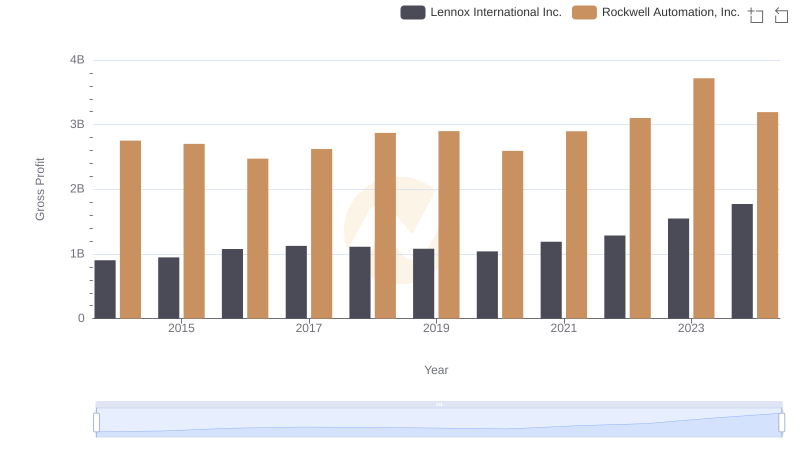
Rockwell Automation, Inc. vs Lennox International Inc.: A Gross Profit Performance Breakdown

Key Insights on Gross Profit: Rockwell Automation, Inc. vs Hubbell Incorporated
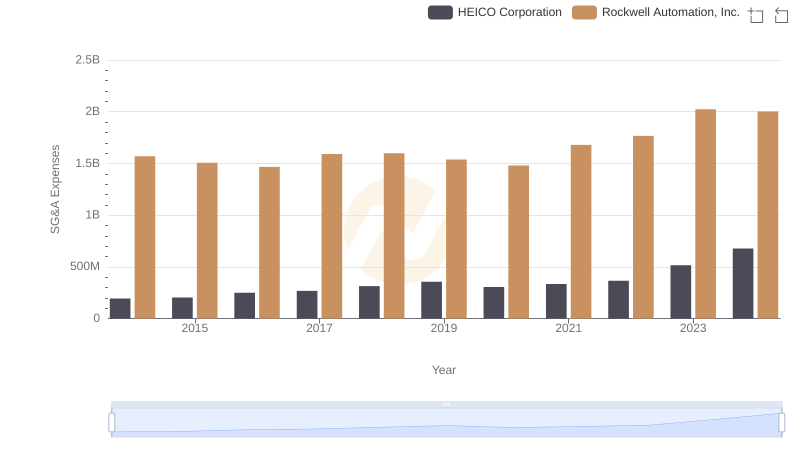
Comparing SG&A Expenses: Rockwell Automation, Inc. vs HEICO Corporation Trends and Insights
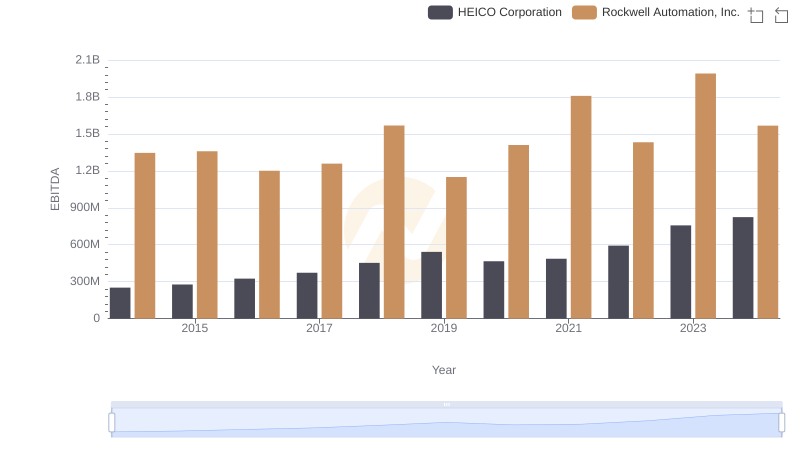
EBITDA Analysis: Evaluating Rockwell Automation, Inc. Against HEICO Corporation