| __timestamp | Intuit Inc. | STMicroelectronics N.V. |
|---|---|---|
| Wednesday, January 1, 2014 | 1528000000 | 1069000000 |
| Thursday, January 1, 2015 | 970000000 | 887000000 |
| Friday, January 1, 2016 | 1480000000 | 1001000000 |
| Sunday, January 1, 2017 | 1634000000 | 1655000000 |
| Monday, January 1, 2018 | 1839000000 | 2197000000 |
| Tuesday, January 1, 2019 | 2121000000 | 2040000000 |
| Wednesday, January 1, 2020 | 2430000000 | 2266000000 |
| Friday, January 1, 2021 | 2948000000 | 3611000000 |
| Saturday, January 1, 2022 | 3369000000 | 6397000000 |
| Sunday, January 1, 2023 | 4043000000 | 6379000000 |
| Monday, January 1, 2024 | 4581000000 |
Data in motion
In the ever-evolving landscape of global technology, understanding financial health is crucial. This analysis delves into the EBITDA performance of two industry giants: Intuit Inc. and STMicroelectronics N.V., from 2014 to 2023.
Intuit Inc., renowned for its financial software, has shown a steady growth trajectory, with EBITDA increasing by approximately 200% over the decade. Notably, from 2020 to 2023, Intuit's EBITDA surged by nearly 67%, reflecting its robust market strategies and expanding customer base.
Conversely, STMicroelectronics, a leader in semiconductor solutions, experienced a remarkable 500% EBITDA growth from 2014 to 2022. However, the data for 2024 remains elusive, leaving room for speculation on its future performance.
This comparative analysis highlights the dynamic nature of the tech industry, where strategic innovation and market adaptation are key to financial success.
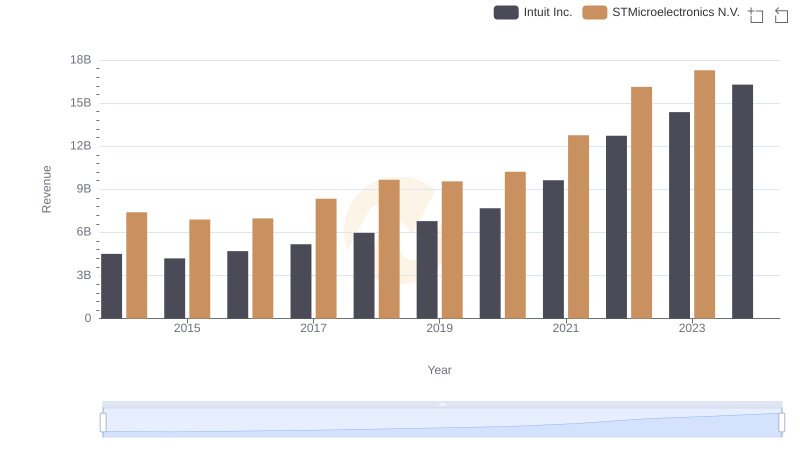
Breaking Down Revenue Trends: Intuit Inc. vs STMicroelectronics N.V.
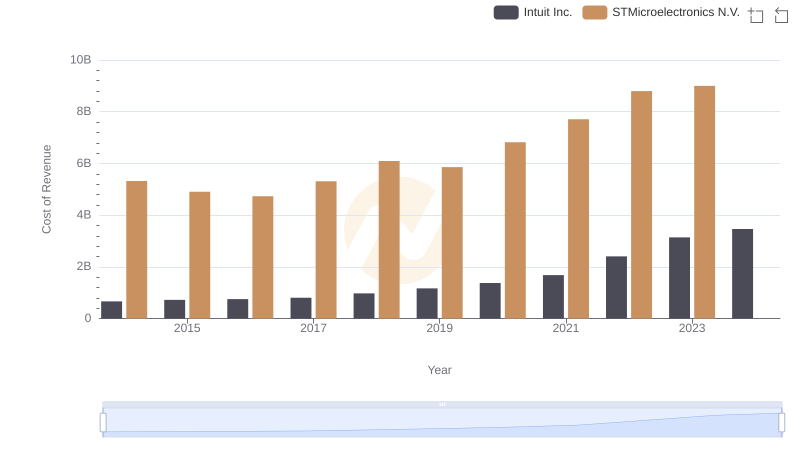
Cost Insights: Breaking Down Intuit Inc. and STMicroelectronics N.V.'s Expenses
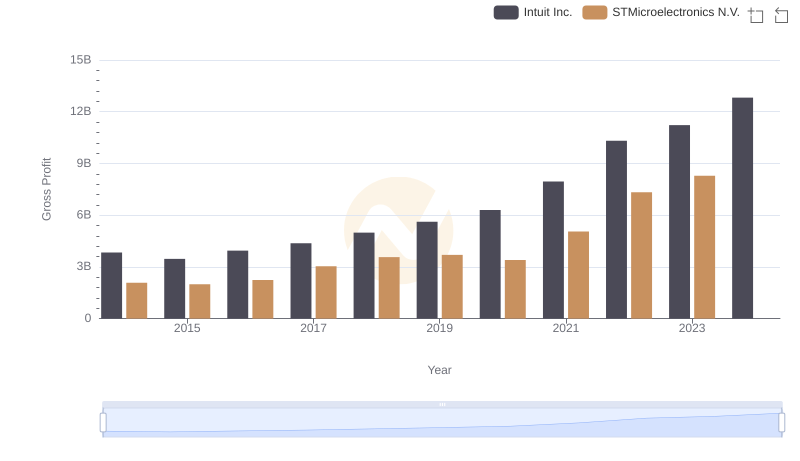
Gross Profit Analysis: Comparing Intuit Inc. and STMicroelectronics N.V.
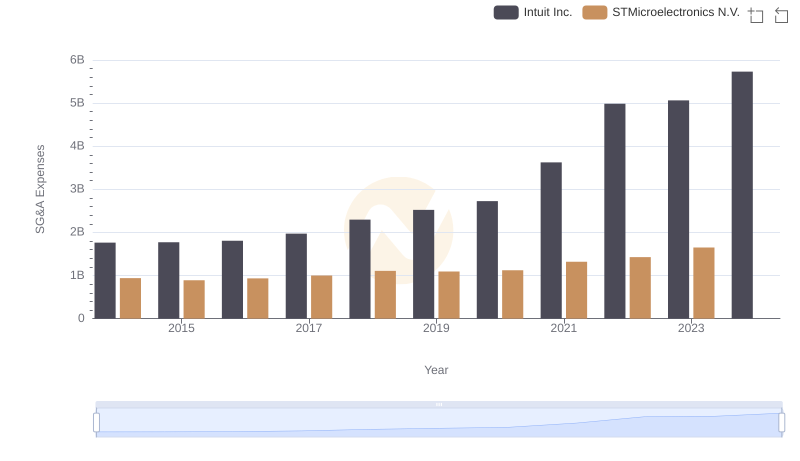
Cost Management Insights: SG&A Expenses for Intuit Inc. and STMicroelectronics N.V.
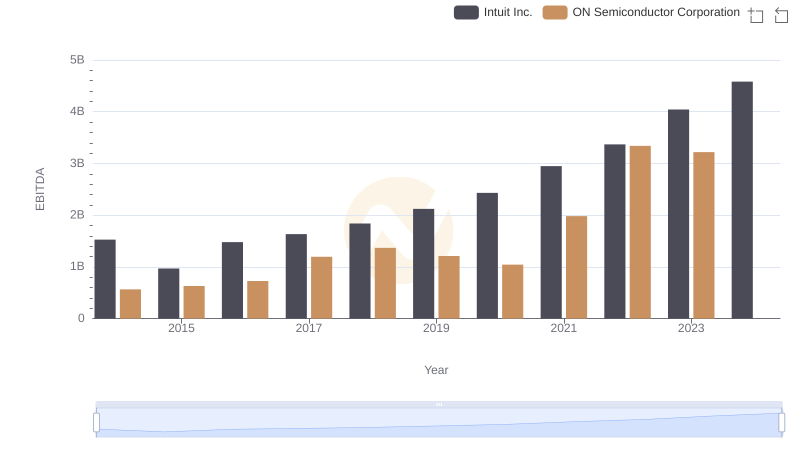
EBITDA Analysis: Evaluating Intuit Inc. Against ON Semiconductor Corporation

Intuit Inc. and Teledyne Technologies Incorporated: A Detailed Examination of EBITDA Performance
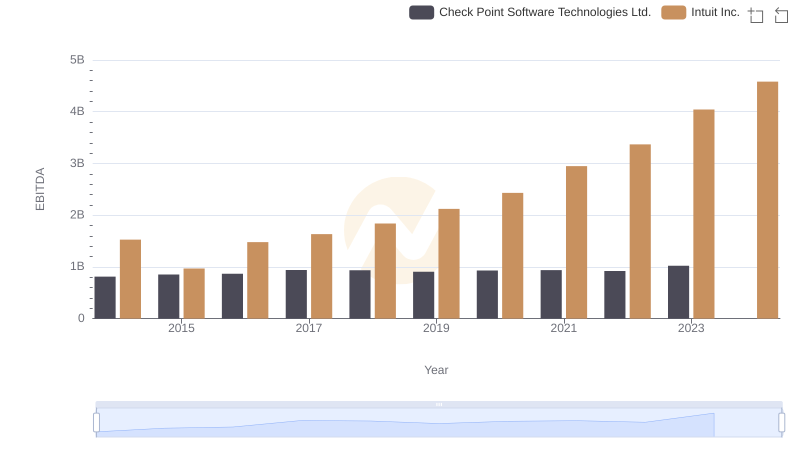
Professional EBITDA Benchmarking: Intuit Inc. vs Check Point Software Technologies Ltd.
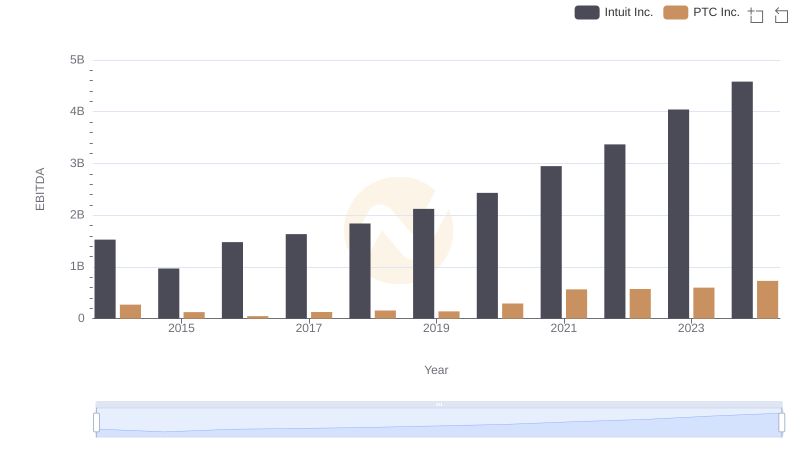
Intuit Inc. vs PTC Inc.: In-Depth EBITDA Performance Comparison
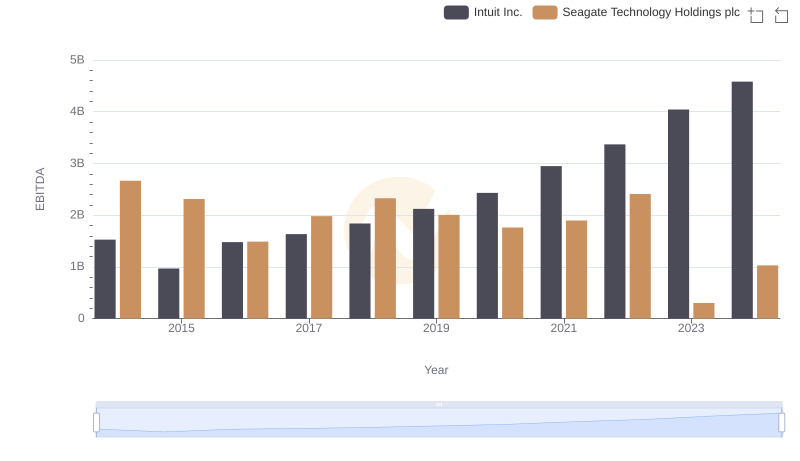
Intuit Inc. vs Seagate Technology Holdings plc: In-Depth EBITDA Performance Comparison
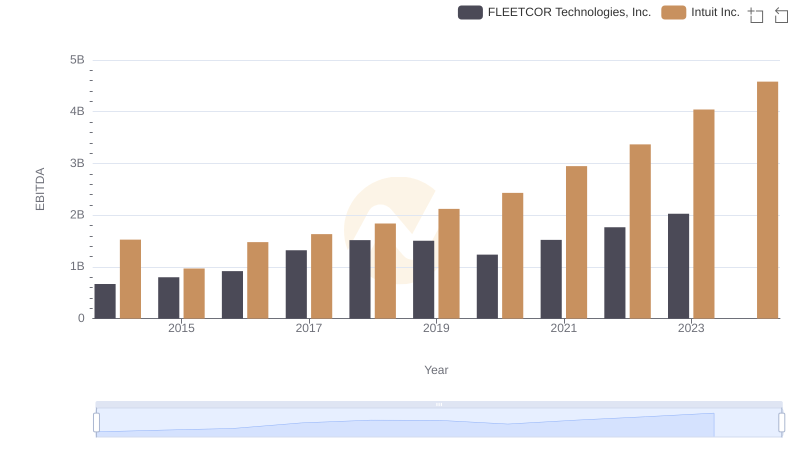
Professional EBITDA Benchmarking: Intuit Inc. vs FLEETCOR Technologies, Inc.
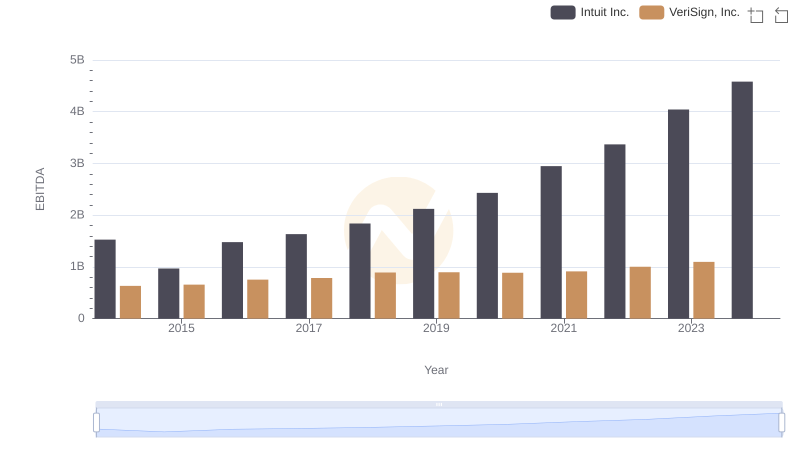
Professional EBITDA Benchmarking: Intuit Inc. vs VeriSign, Inc.