| __timestamp | Intuit Inc. | Seagate Technology Holdings plc |
|---|---|---|
| Wednesday, January 1, 2014 | 1528000000 | 2665000000 |
| Thursday, January 1, 2015 | 970000000 | 2312000000 |
| Friday, January 1, 2016 | 1480000000 | 1488000000 |
| Sunday, January 1, 2017 | 1634000000 | 1981000000 |
| Monday, January 1, 2018 | 1839000000 | 2328000000 |
| Tuesday, January 1, 2019 | 2121000000 | 2006000000 |
| Wednesday, January 1, 2020 | 2430000000 | 1761000000 |
| Friday, January 1, 2021 | 2948000000 | 1897000000 |
| Saturday, January 1, 2022 | 3369000000 | 2409000000 |
| Sunday, January 1, 2023 | 4043000000 | 301000000 |
| Monday, January 1, 2024 | 4581000000 | 1030000000 |
Unveiling the hidden dimensions of data
In the ever-evolving landscape of technology, the financial performance of industry giants like Intuit Inc. and Seagate Technology Holdings plc offers a fascinating glimpse into their strategic maneuvers. Over the past decade, Intuit has demonstrated a remarkable upward trajectory in EBITDA, growing by approximately 200% from 2014 to 2024. This growth underscores Intuit's robust business model and its ability to adapt to changing market dynamics.
Conversely, Seagate Technology has faced a more turbulent journey. While it started strong in 2014, its EBITDA has seen fluctuations, with a notable dip in 2023, reflecting the challenges in the data storage sector. Despite these hurdles, Seagate's resilience is evident as it continues to innovate and adapt.
This comparative analysis not only highlights the contrasting paths of these two tech titans but also provides valuable insights into the broader trends shaping the technology industry.
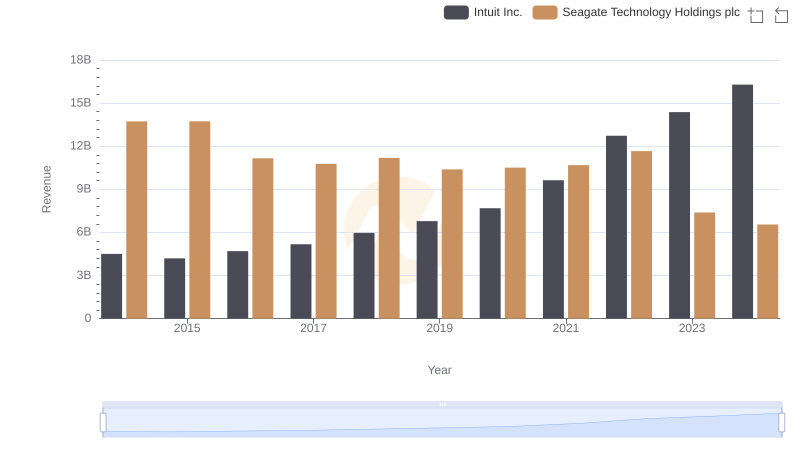
Revenue Showdown: Intuit Inc. vs Seagate Technology Holdings plc
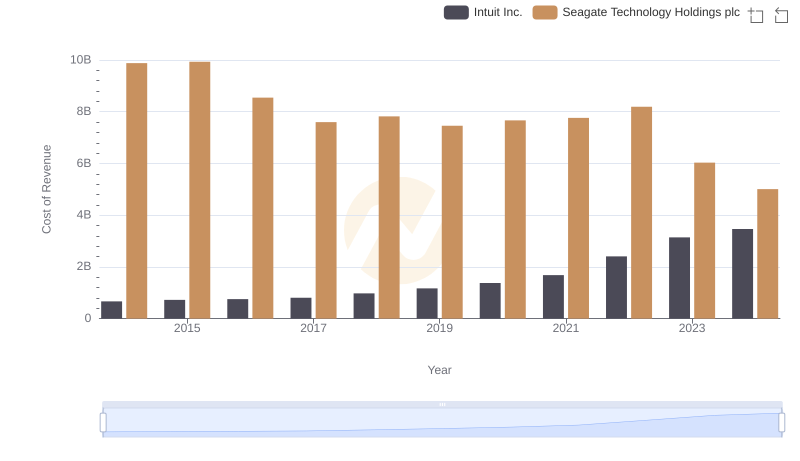
Cost Insights: Breaking Down Intuit Inc. and Seagate Technology Holdings plc's Expenses
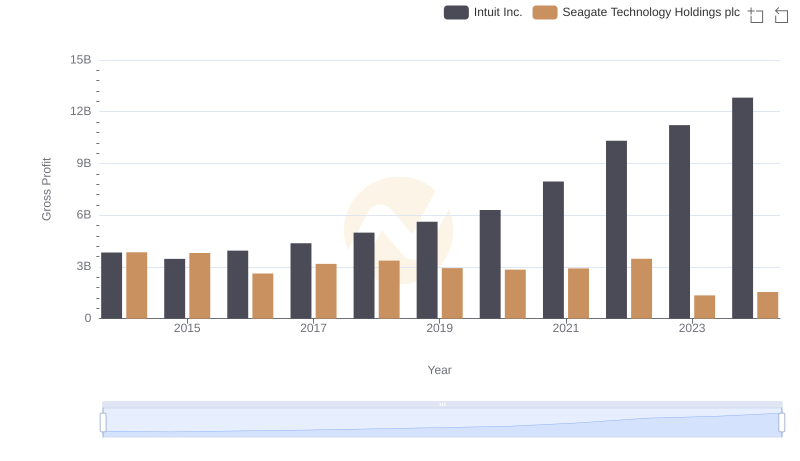
Gross Profit Analysis: Comparing Intuit Inc. and Seagate Technology Holdings plc
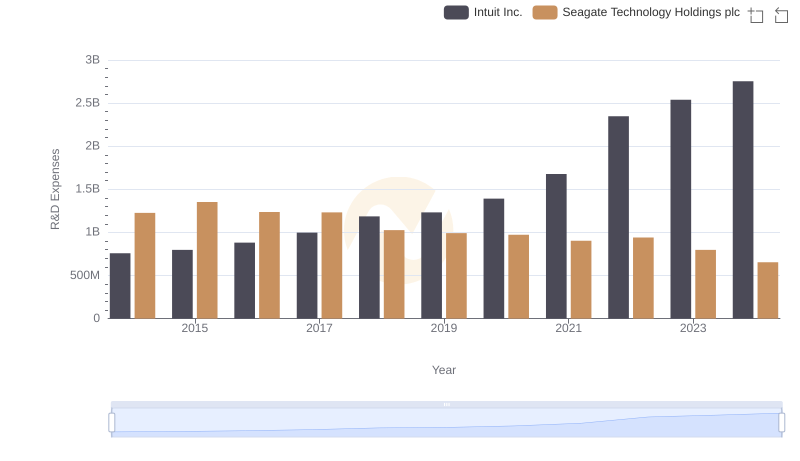
Research and Development Investment: Intuit Inc. vs Seagate Technology Holdings plc
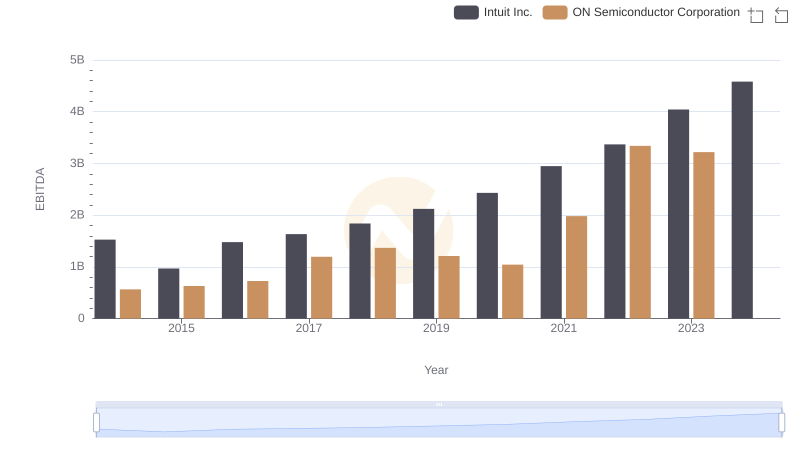
EBITDA Analysis: Evaluating Intuit Inc. Against ON Semiconductor Corporation
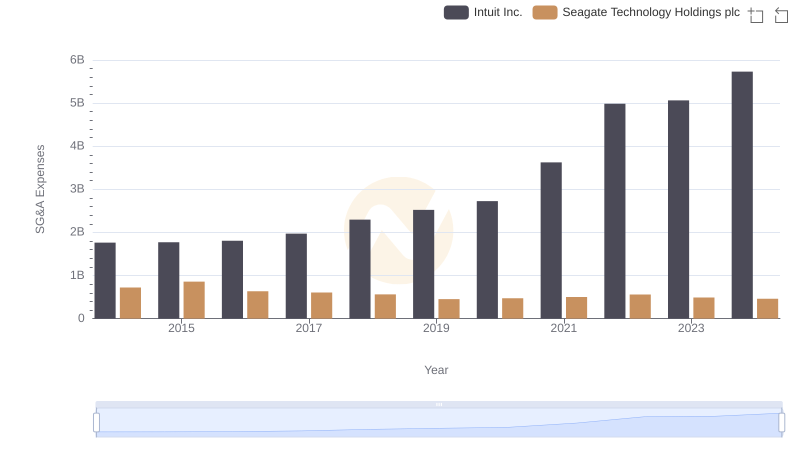
Cost Management Insights: SG&A Expenses for Intuit Inc. and Seagate Technology Holdings plc

Intuit Inc. and Teledyne Technologies Incorporated: A Detailed Examination of EBITDA Performance
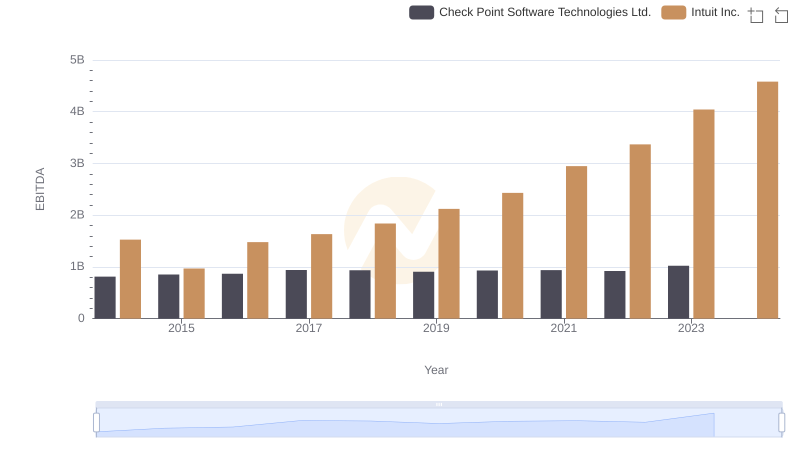
Professional EBITDA Benchmarking: Intuit Inc. vs Check Point Software Technologies Ltd.
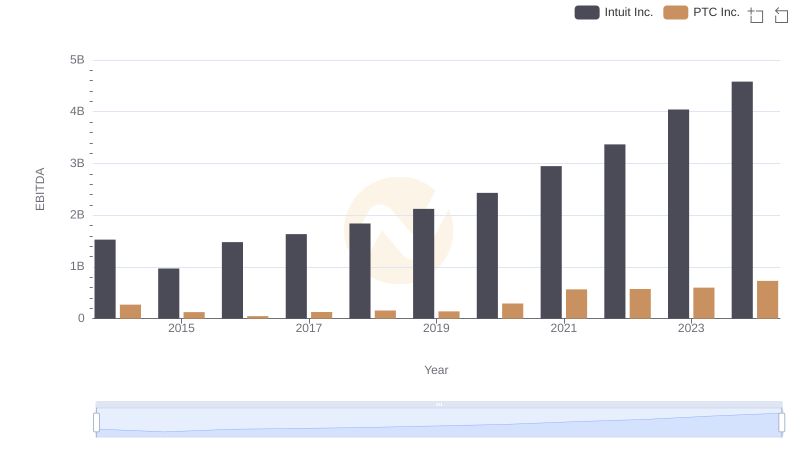
Intuit Inc. vs PTC Inc.: In-Depth EBITDA Performance Comparison
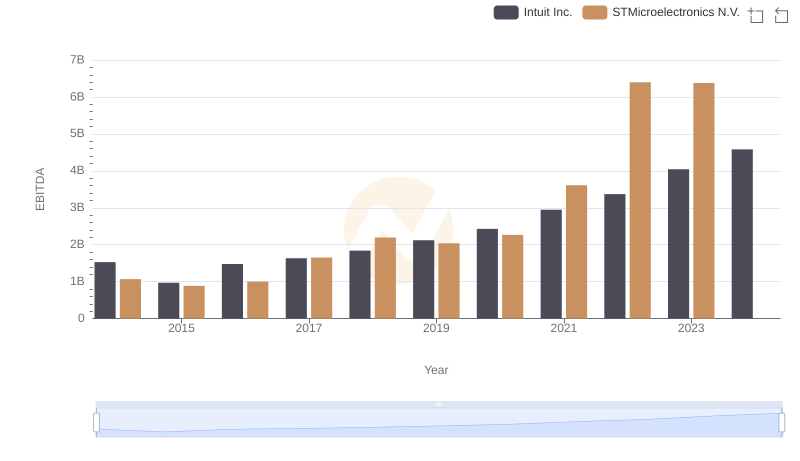
EBITDA Analysis: Evaluating Intuit Inc. Against STMicroelectronics N.V.
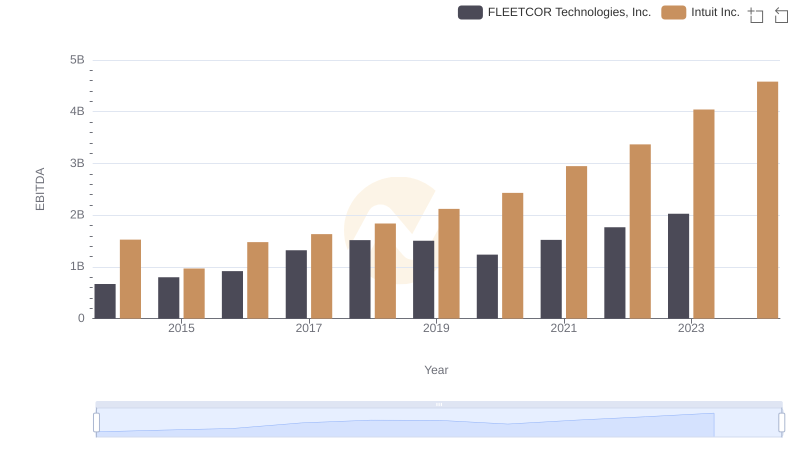
Professional EBITDA Benchmarking: Intuit Inc. vs FLEETCOR Technologies, Inc.
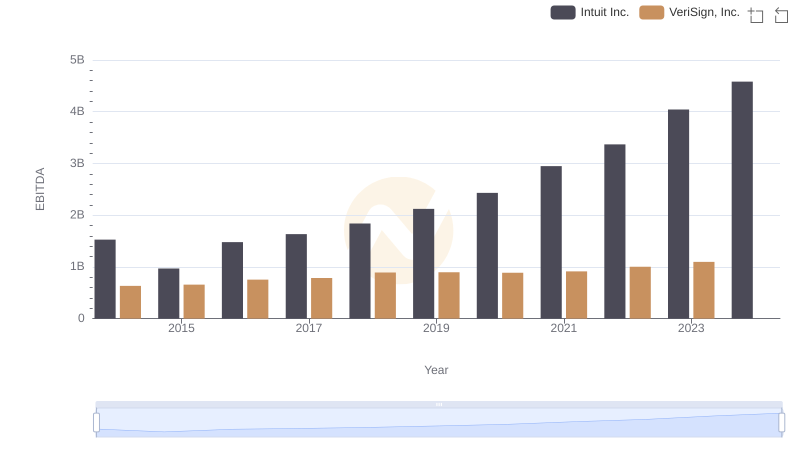
Professional EBITDA Benchmarking: Intuit Inc. vs VeriSign, Inc.