| __timestamp | Intuit Inc. | PTC Inc. |
|---|---|---|
| Wednesday, January 1, 2014 | 1528000000 | 271574000 |
| Thursday, January 1, 2015 | 970000000 | 125699999 |
| Friday, January 1, 2016 | 1480000000 | 49244000 |
| Sunday, January 1, 2017 | 1634000000 | 127736000 |
| Monday, January 1, 2018 | 1839000000 | 157737000 |
| Tuesday, January 1, 2019 | 2121000000 | 141171000 |
| Wednesday, January 1, 2020 | 2430000000 | 291951000 |
| Friday, January 1, 2021 | 2948000000 | 564767000 |
| Saturday, January 1, 2022 | 3369000000 | 573406000 |
| Sunday, January 1, 2023 | 4043000000 | 599145000 |
| Monday, January 1, 2024 | 4581000000 | 730022000 |
Unleashing the power of data
In the ever-evolving landscape of financial technology, Intuit Inc. and PTC Inc. have showcased remarkable trajectories in their EBITDA performance from 2014 to 2024. Intuit Inc., a leader in financial software, has seen its EBITDA grow by an impressive 200%, from approximately $1.5 billion in 2014 to an estimated $4.6 billion in 2024. This growth underscores Intuit's strategic prowess in expanding its market share and enhancing operational efficiency.
Conversely, PTC Inc., a key player in digital transformation solutions, has experienced a more modest yet significant growth of around 170% in the same period, with EBITDA rising from $272 million to $730 million. This steady increase highlights PTC's commitment to innovation and adaptation in a competitive market.
The data reveals a compelling narrative of two companies navigating the financial currents with distinct strategies, offering valuable insights into their future potential.
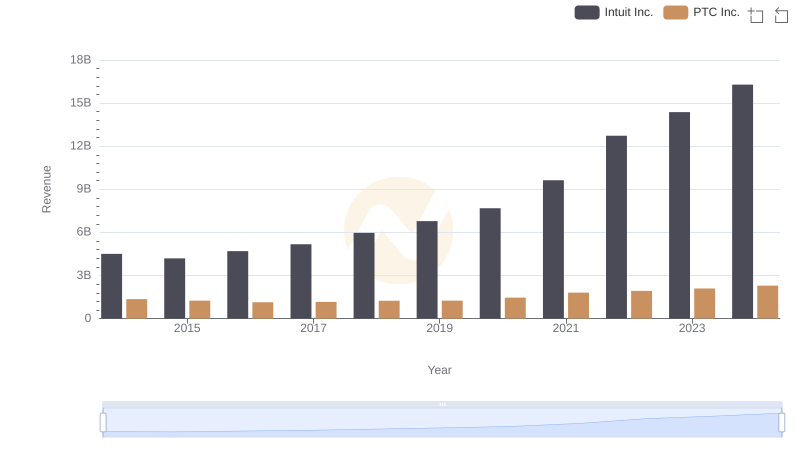
Annual Revenue Comparison: Intuit Inc. vs PTC Inc.
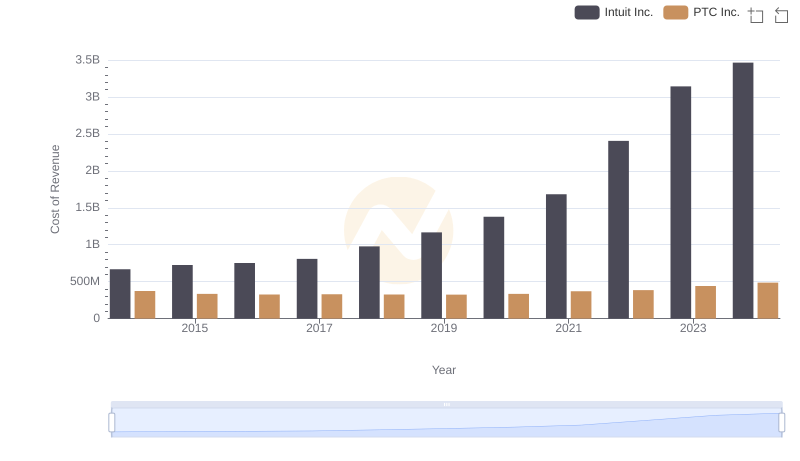
Cost of Revenue: Key Insights for Intuit Inc. and PTC Inc.
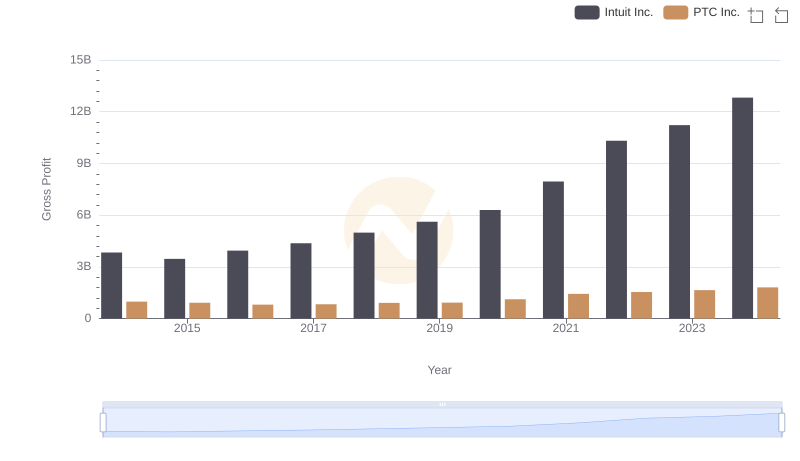
Gross Profit Analysis: Comparing Intuit Inc. and PTC Inc.
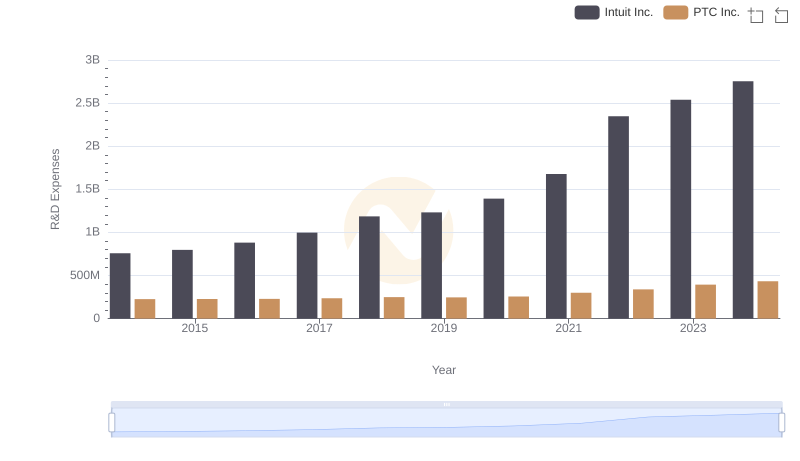
Who Prioritizes Innovation? R&D Spending Compared for Intuit Inc. and PTC Inc.
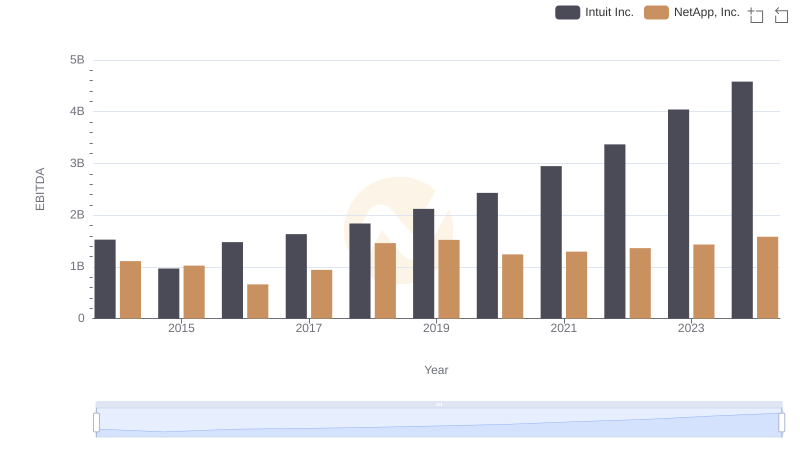
A Side-by-Side Analysis of EBITDA: Intuit Inc. and NetApp, Inc.
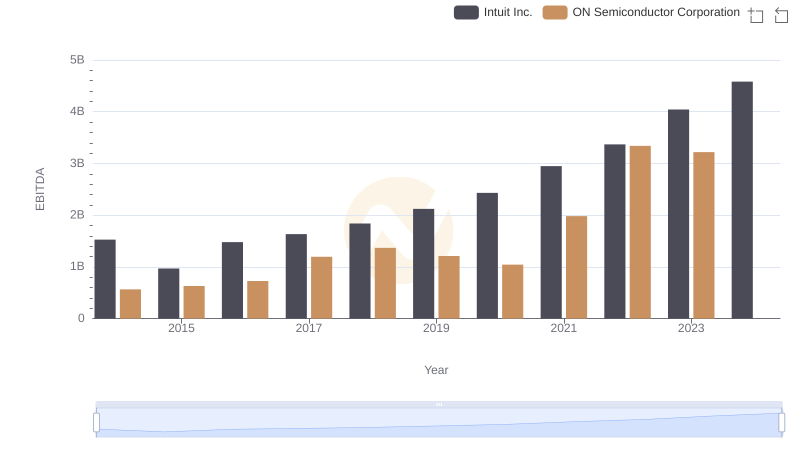
EBITDA Analysis: Evaluating Intuit Inc. Against ON Semiconductor Corporation
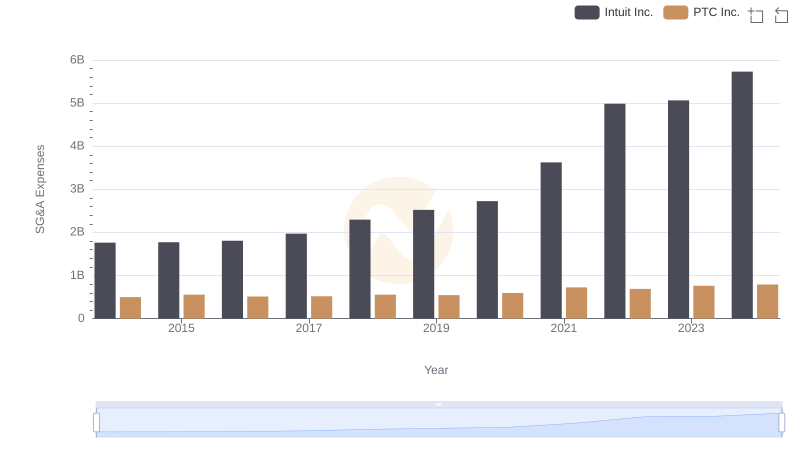
Selling, General, and Administrative Costs: Intuit Inc. vs PTC Inc.

Intuit Inc. and Teledyne Technologies Incorporated: A Detailed Examination of EBITDA Performance
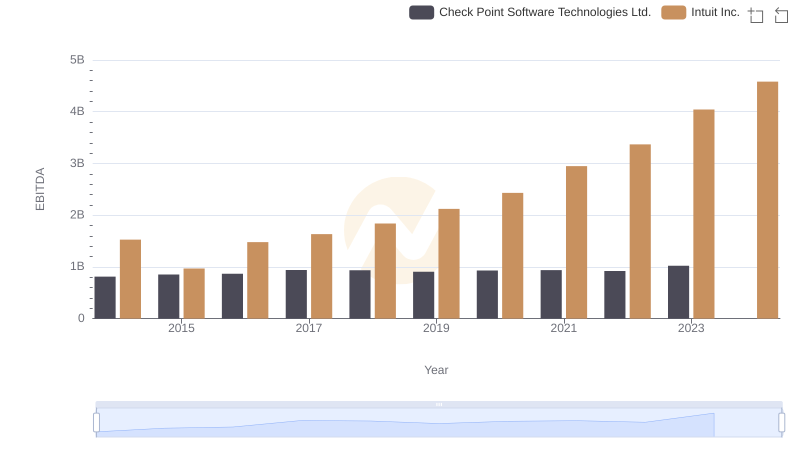
Professional EBITDA Benchmarking: Intuit Inc. vs Check Point Software Technologies Ltd.
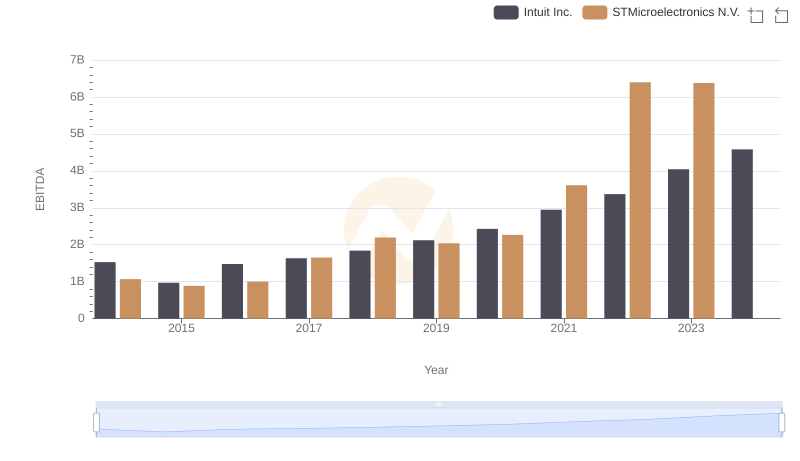
EBITDA Analysis: Evaluating Intuit Inc. Against STMicroelectronics N.V.
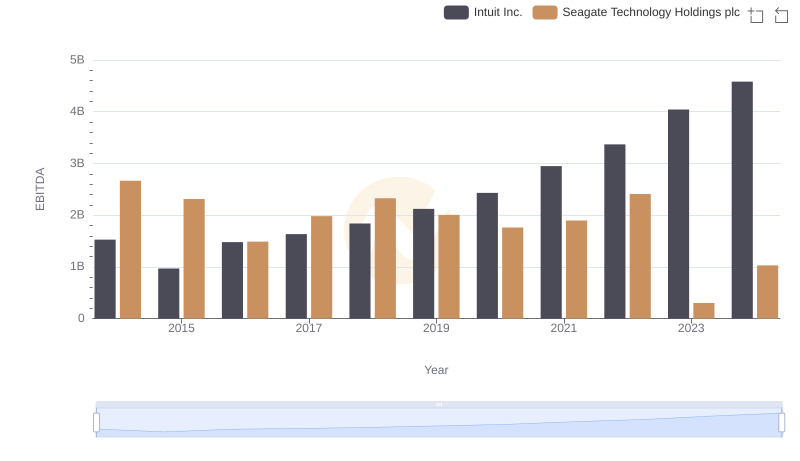
Intuit Inc. vs Seagate Technology Holdings plc: In-Depth EBITDA Performance Comparison
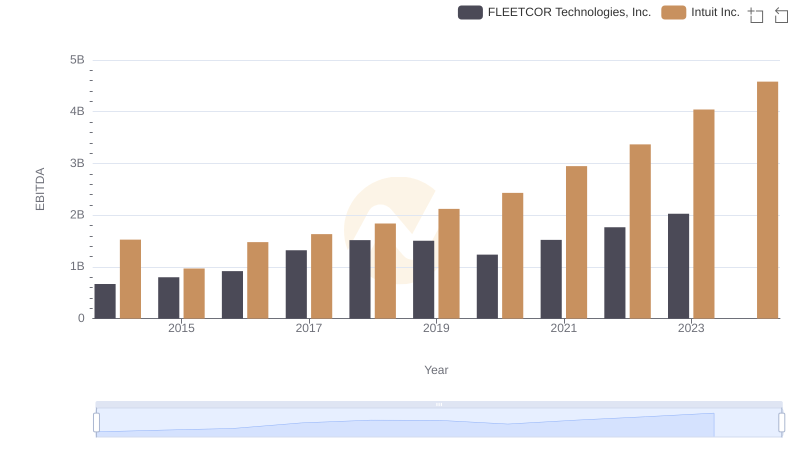
Professional EBITDA Benchmarking: Intuit Inc. vs FLEETCOR Technologies, Inc.