| __timestamp | Intuit Inc. | Zebra Technologies Corporation |
|---|---|---|
| Wednesday, January 1, 2014 | 1762000000 | 351518000 |
| Thursday, January 1, 2015 | 1771000000 | 763025000 |
| Friday, January 1, 2016 | 1807000000 | 751000000 |
| Sunday, January 1, 2017 | 1973000000 | 749000000 |
| Monday, January 1, 2018 | 2298000000 | 811000000 |
| Tuesday, January 1, 2019 | 2524000000 | 826000000 |
| Wednesday, January 1, 2020 | 2727000000 | 787000000 |
| Friday, January 1, 2021 | 3626000000 | 935000000 |
| Saturday, January 1, 2022 | 4986000000 | 982000000 |
| Sunday, January 1, 2023 | 5062000000 | 915000000 |
| Monday, January 1, 2024 | 5730000000 | 981000000 |
Unlocking the unknown
In the ever-evolving landscape of corporate finance, understanding operational costs is crucial. Over the past decade, Intuit Inc. and Zebra Technologies Corporation have showcased distinct trajectories in their Selling, General, and Administrative (SG&A) expenses. From 2014 to 2023, Intuit's SG&A expenses surged by over 225%, reflecting its aggressive growth strategy and market expansion. In contrast, Zebra Technologies exhibited a more stable pattern, with a modest increase of around 160% over the same period.
Intuit's expenses peaked in 2024, reaching a staggering 5.73 billion, while Zebra's data for 2024 remains elusive. This comparison highlights Intuit's dynamic approach in scaling operations, whereas Zebra maintains a steady course. As businesses navigate the complexities of the modern economy, these insights into SG&A trends offer valuable lessons in strategic financial management.
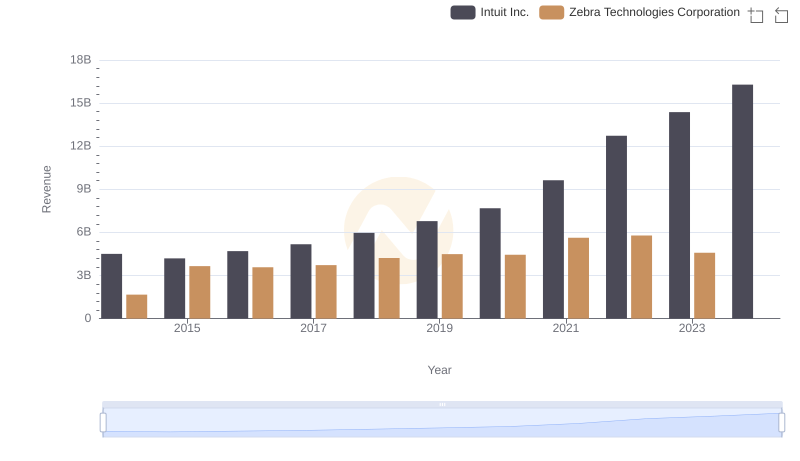
Intuit Inc. vs Zebra Technologies Corporation: Examining Key Revenue Metrics
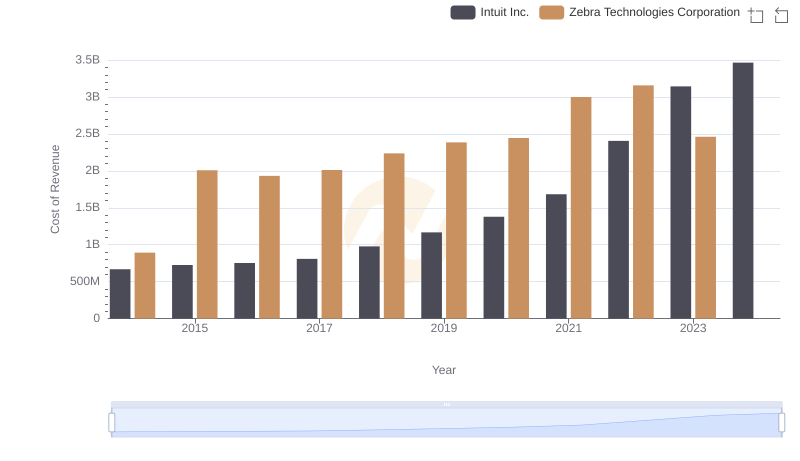
Cost of Revenue: Key Insights for Intuit Inc. and Zebra Technologies Corporation
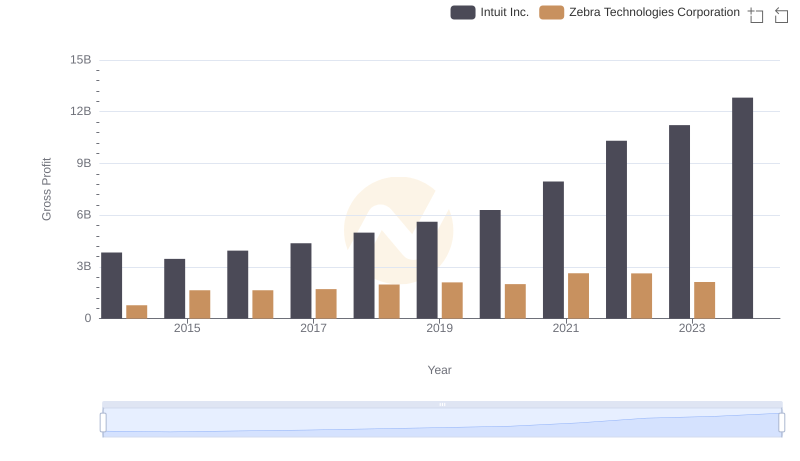
Who Generates Higher Gross Profit? Intuit Inc. or Zebra Technologies Corporation
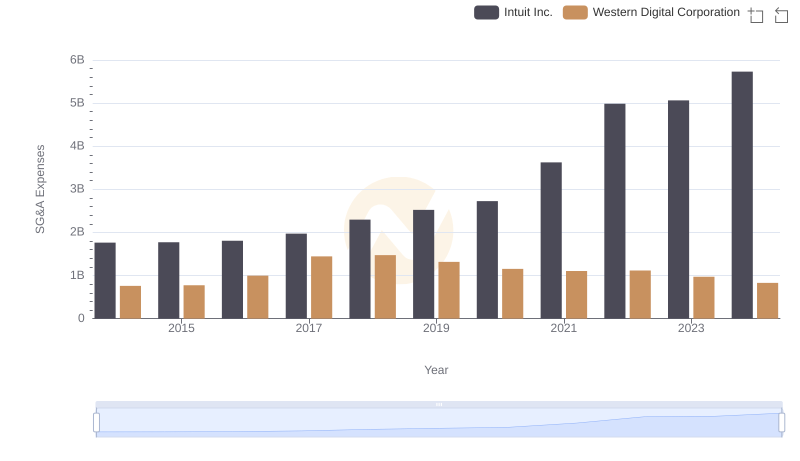
Intuit Inc. or Western Digital Corporation: Who Manages SG&A Costs Better?
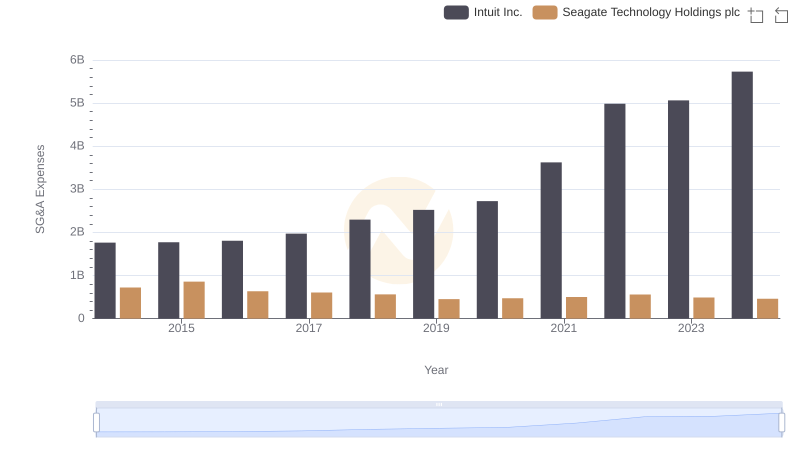
Cost Management Insights: SG&A Expenses for Intuit Inc. and Seagate Technology Holdings plc
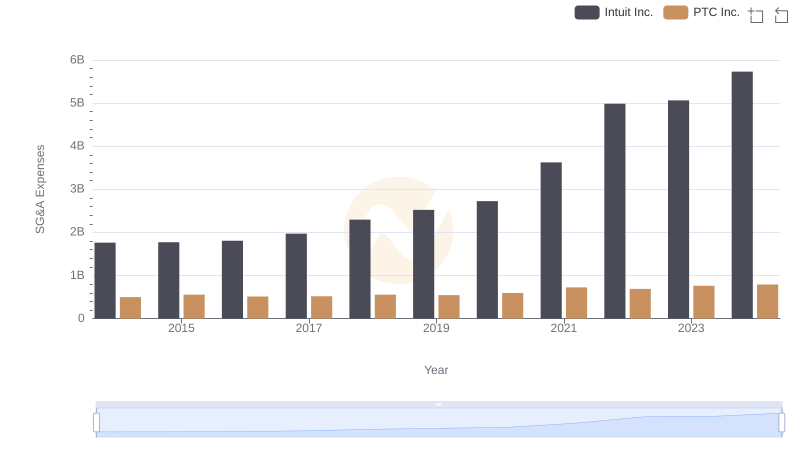
Selling, General, and Administrative Costs: Intuit Inc. vs PTC Inc.
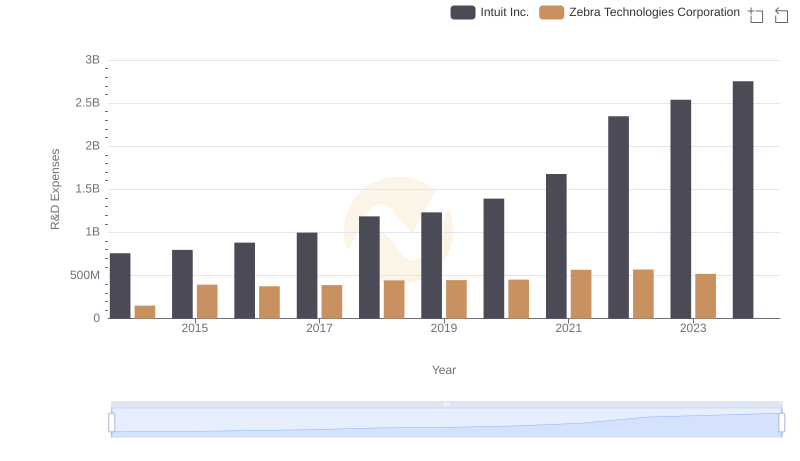
Intuit Inc. vs Zebra Technologies Corporation: Strategic Focus on R&D Spending
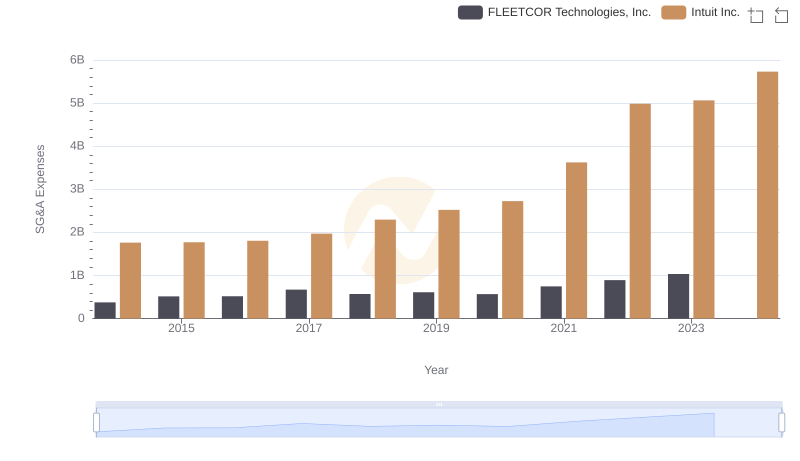
Comparing SG&A Expenses: Intuit Inc. vs FLEETCOR Technologies, Inc. Trends and Insights
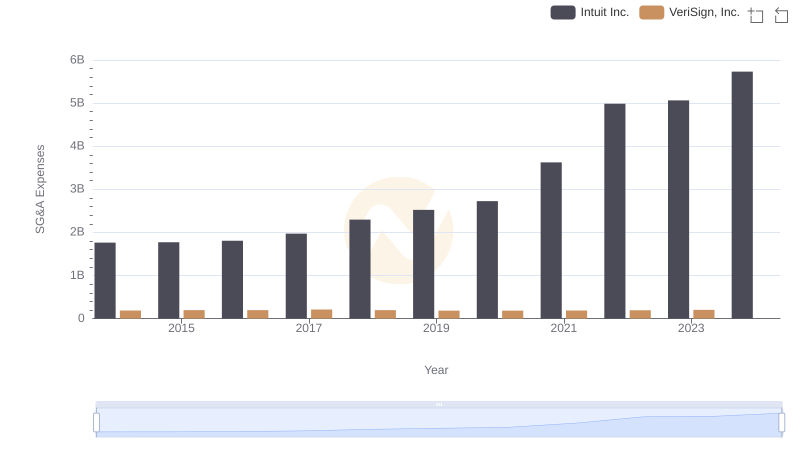
Intuit Inc. vs VeriSign, Inc.: SG&A Expense Trends
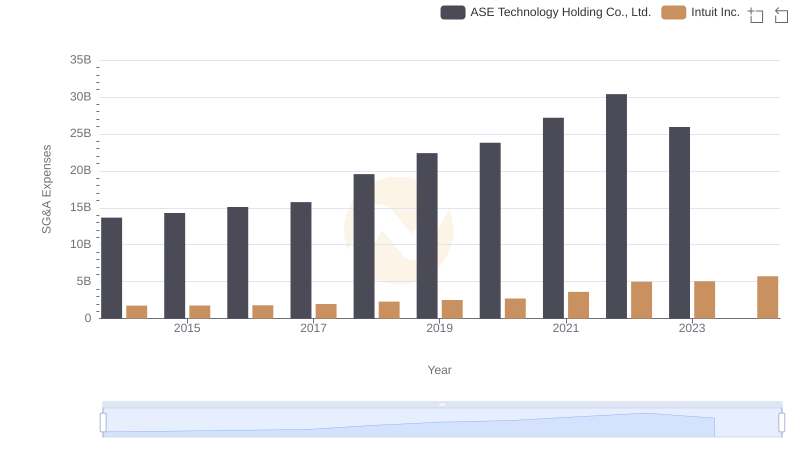
Cost Management Insights: SG&A Expenses for Intuit Inc. and ASE Technology Holding Co., Ltd.
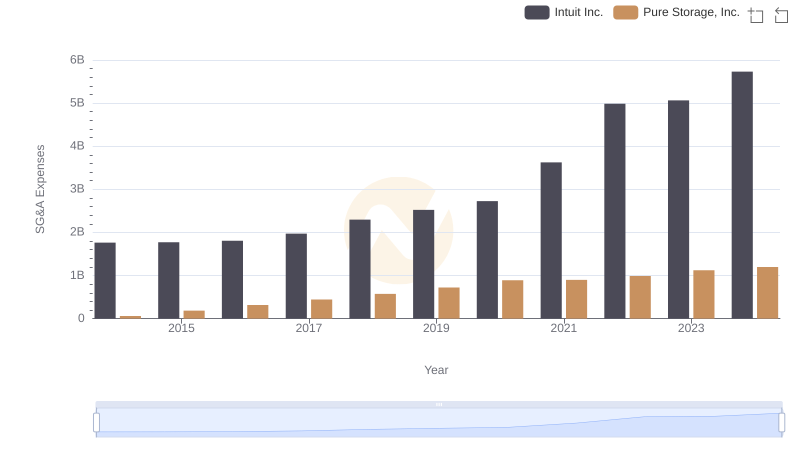
Comparing SG&A Expenses: Intuit Inc. vs Pure Storage, Inc. Trends and Insights
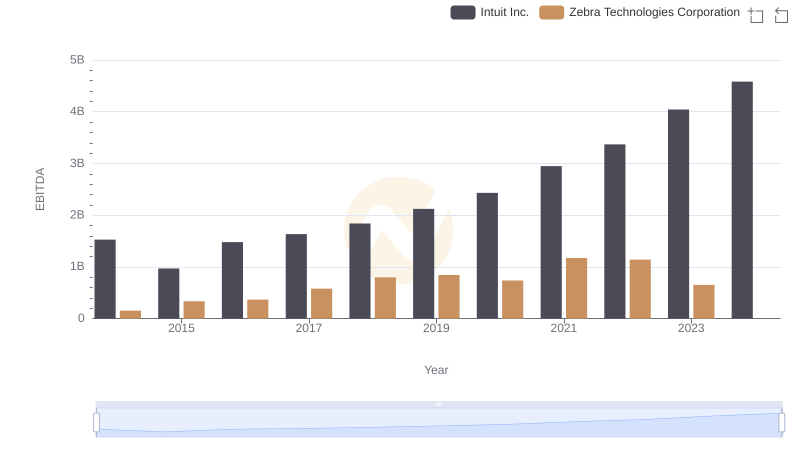
EBITDA Analysis: Evaluating Intuit Inc. Against Zebra Technologies Corporation