| __timestamp | Check Point Software Technologies Ltd. | Intuit Inc. |
|---|---|---|
| Wednesday, January 1, 2014 | 812338000 | 1528000000 |
| Thursday, January 1, 2015 | 853687000 | 970000000 |
| Friday, January 1, 2016 | 867006000 | 1480000000 |
| Sunday, January 1, 2017 | 940553000 | 1634000000 |
| Monday, January 1, 2018 | 934562000 | 1839000000 |
| Tuesday, January 1, 2019 | 905800000 | 2121000000 |
| Wednesday, January 1, 2020 | 931300000 | 2430000000 |
| Friday, January 1, 2021 | 938200000 | 2948000000 |
| Saturday, January 1, 2022 | 920500000 | 3369000000 |
| Sunday, January 1, 2023 | 1023000000 | 4043000000 |
| Monday, January 1, 2024 | 4581000000 |
In pursuit of knowledge
In the ever-evolving landscape of technology, financial performance is a key indicator of a company's resilience and growth. Over the past decade, Intuit Inc. and Check Point Software Technologies Ltd. have demonstrated contrasting trajectories in their EBITDA, a crucial measure of profitability.
From 2014 to 2023, Intuit Inc. has seen a remarkable increase in EBITDA, growing by approximately 165%, from 1.5 billion to 4 billion. This growth underscores Intuit's strategic expansion and innovation in financial software solutions. In contrast, Check Point Software Technologies Ltd. has maintained a steady EBITDA, with a modest increase of around 26% over the same period, reflecting its stable position in the cybersecurity sector.
The data for 2024 is incomplete, highlighting the dynamic nature of financial forecasting. As these companies continue to navigate the competitive tech industry, their financial strategies will be pivotal in shaping their future success.
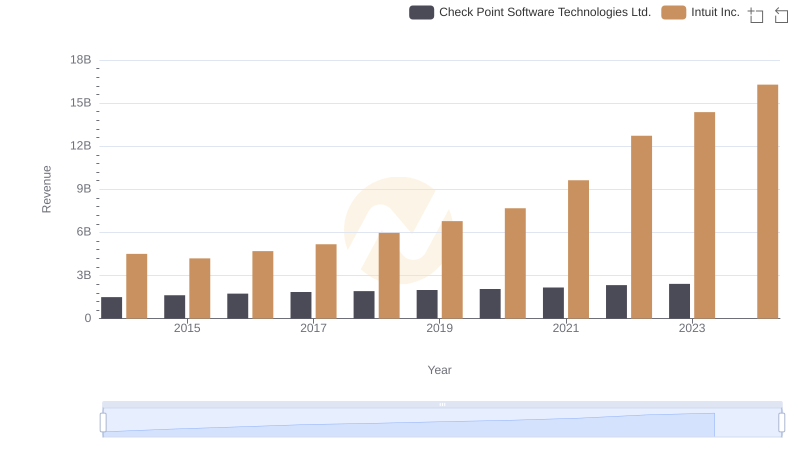
Intuit Inc. and Check Point Software Technologies Ltd.: A Comprehensive Revenue Analysis
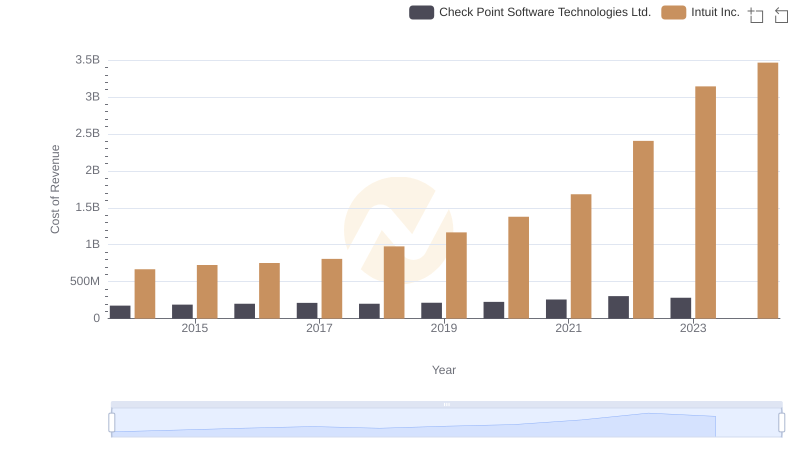
Comparing Cost of Revenue Efficiency: Intuit Inc. vs Check Point Software Technologies Ltd.
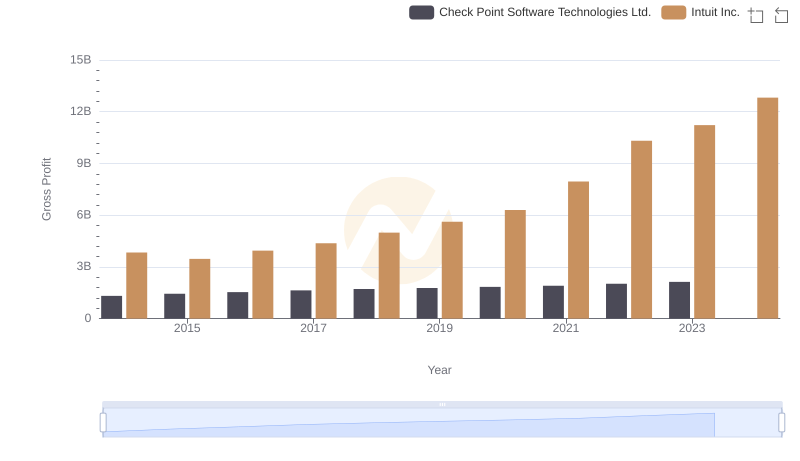
Who Generates Higher Gross Profit? Intuit Inc. or Check Point Software Technologies Ltd.
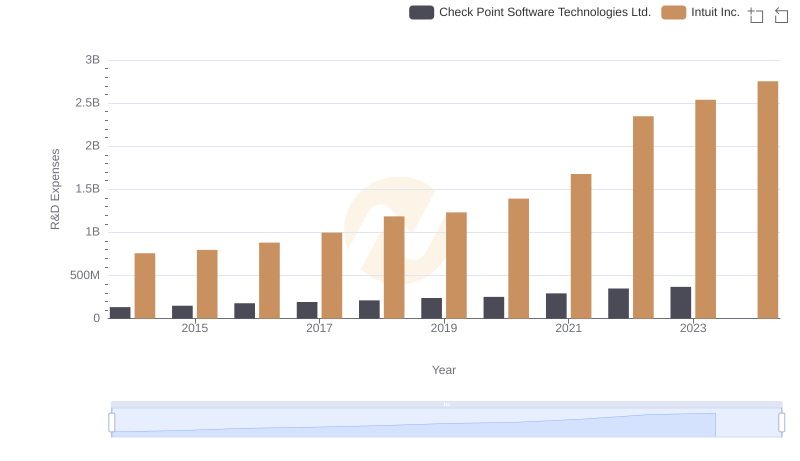
R&D Spending Showdown: Intuit Inc. vs Check Point Software Technologies Ltd.
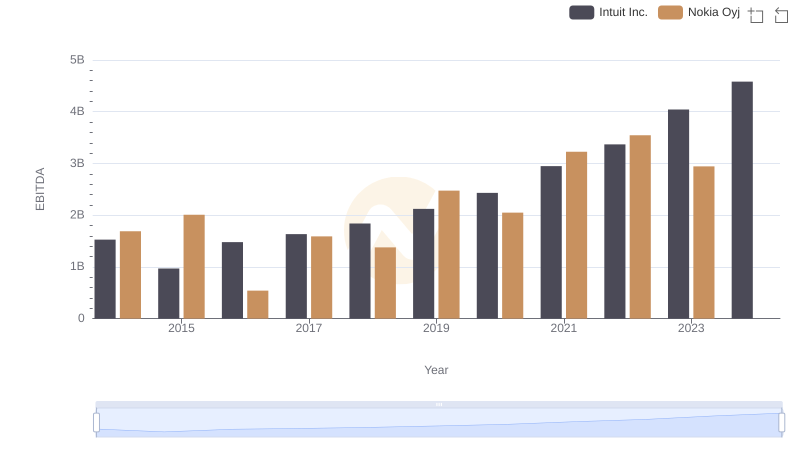
EBITDA Metrics Evaluated: Intuit Inc. vs Nokia Oyj
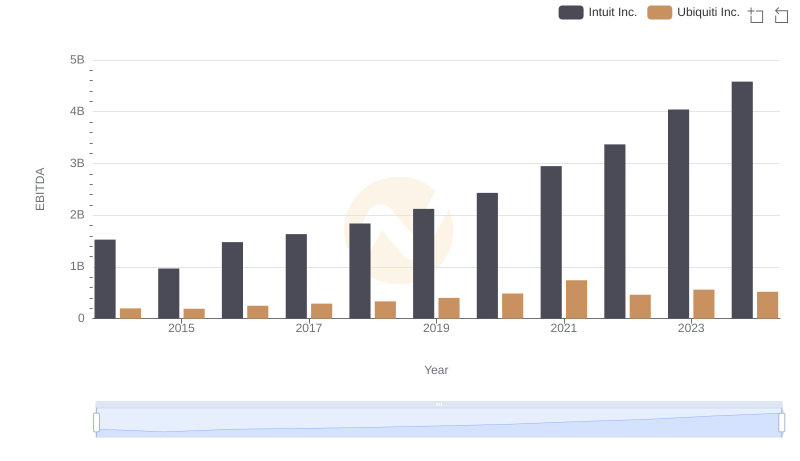
A Professional Review of EBITDA: Intuit Inc. Compared to Ubiquiti Inc.
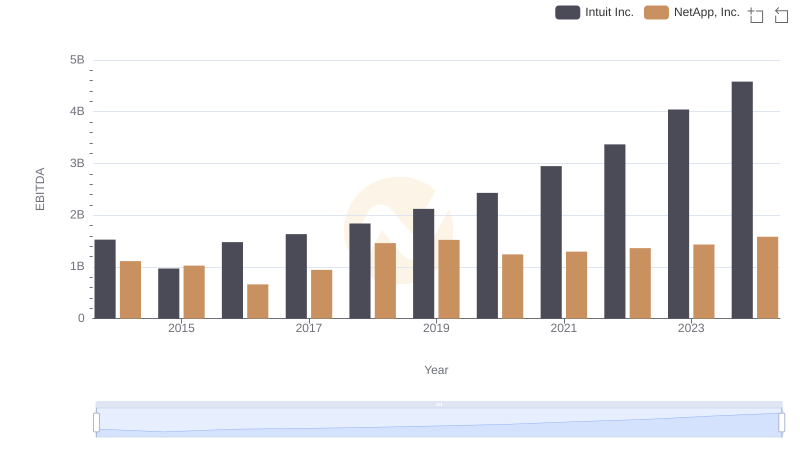
A Side-by-Side Analysis of EBITDA: Intuit Inc. and NetApp, Inc.
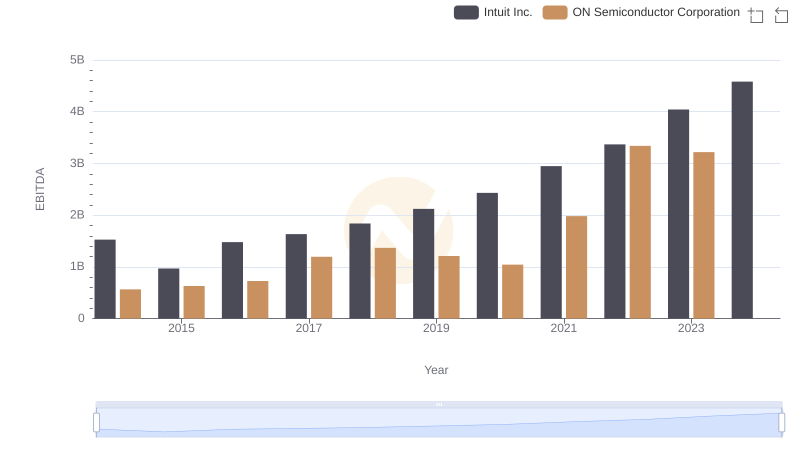
EBITDA Analysis: Evaluating Intuit Inc. Against ON Semiconductor Corporation

Intuit Inc. and Teledyne Technologies Incorporated: A Detailed Examination of EBITDA Performance
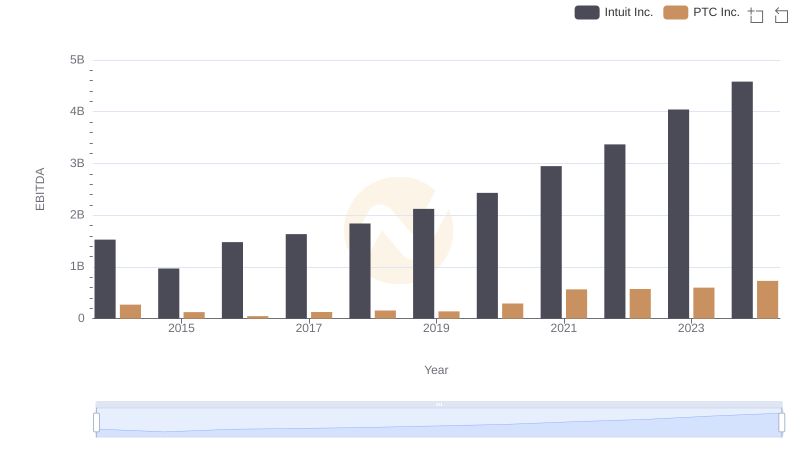
Intuit Inc. vs PTC Inc.: In-Depth EBITDA Performance Comparison
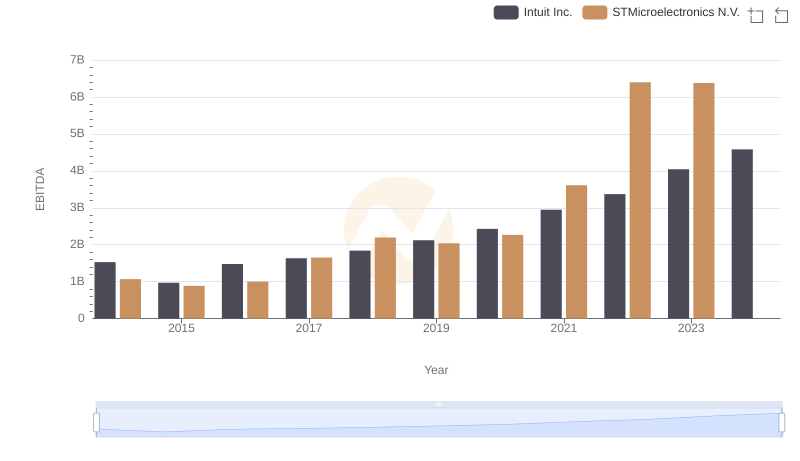
EBITDA Analysis: Evaluating Intuit Inc. Against STMicroelectronics N.V.