| __timestamp | Intuit Inc. | ON Semiconductor Corporation |
|---|---|---|
| Wednesday, January 1, 2014 | 1528000000 | 564800000 |
| Thursday, January 1, 2015 | 970000000 | 631800000 |
| Friday, January 1, 2016 | 1480000000 | 727800000 |
| Sunday, January 1, 2017 | 1634000000 | 1196700000 |
| Monday, January 1, 2018 | 1839000000 | 1366800000 |
| Tuesday, January 1, 2019 | 2121000000 | 1210600000 |
| Wednesday, January 1, 2020 | 2430000000 | 1043400000 |
| Friday, January 1, 2021 | 2948000000 | 1981800000 |
| Saturday, January 1, 2022 | 3369000000 | 3338900000 |
| Sunday, January 1, 2023 | 4043000000 | 3220100000 |
| Monday, January 1, 2024 | 4581000000 | 1767700000 |
Unlocking the unknown
In the ever-evolving landscape of technology and semiconductor industries, understanding financial health is crucial. This analysis delves into the EBITDA growth of Intuit Inc. and ON Semiconductor Corporation from 2014 to 2023. Intuit Inc., a leader in financial software, has shown a remarkable upward trajectory, with its EBITDA growing by approximately 200% over the decade. In contrast, ON Semiconductor Corporation, a key player in the semiconductor sector, experienced a significant rise, particularly between 2021 and 2022, where its EBITDA nearly doubled. However, data for 2024 is missing for ON Semiconductor, leaving a gap in the latest comparison. This financial journey highlights the resilience and strategic growth of these companies, offering valuable insights for investors and industry enthusiasts alike.
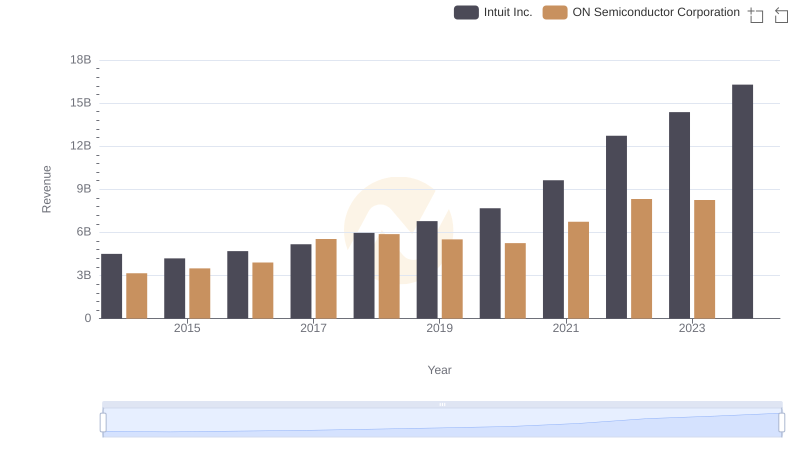
Revenue Showdown: Intuit Inc. vs ON Semiconductor Corporation
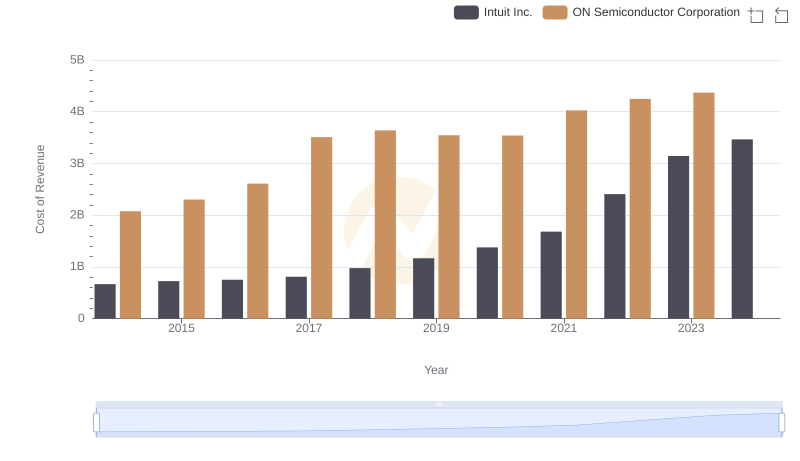
Comparing Cost of Revenue Efficiency: Intuit Inc. vs ON Semiconductor Corporation
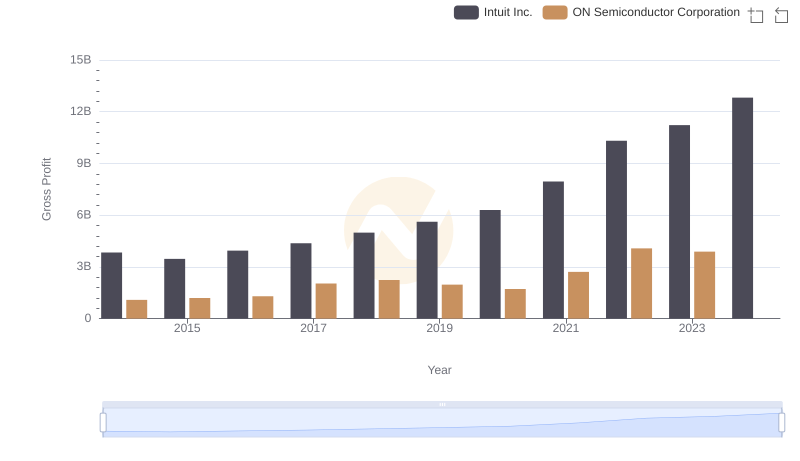
Intuit Inc. vs ON Semiconductor Corporation: A Gross Profit Performance Breakdown
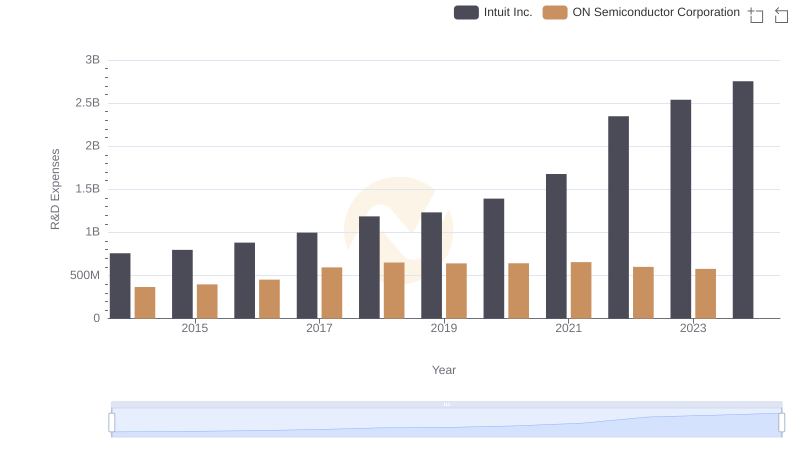
Research and Development Expenses Breakdown: Intuit Inc. vs ON Semiconductor Corporation
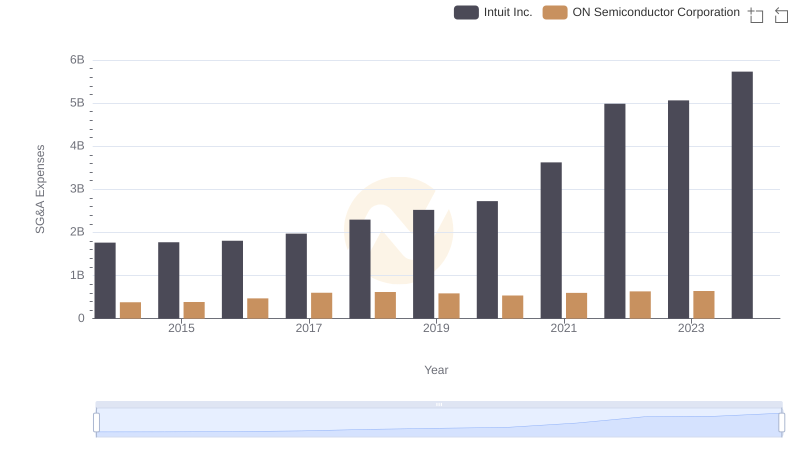
Intuit Inc. vs ON Semiconductor Corporation: SG&A Expense Trends
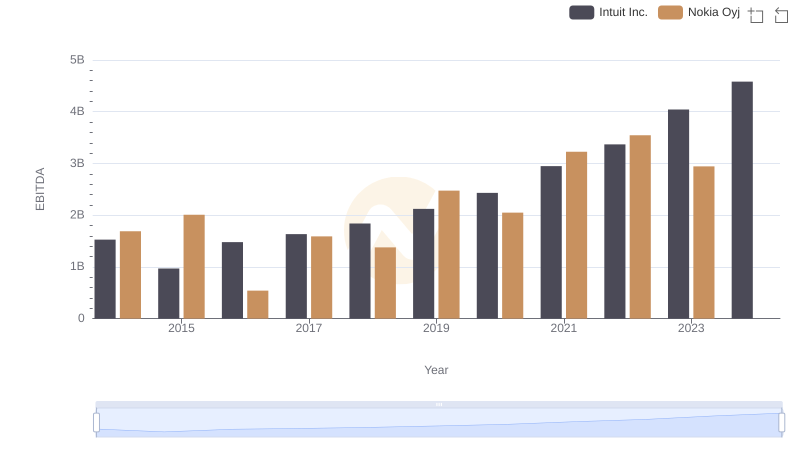
EBITDA Metrics Evaluated: Intuit Inc. vs Nokia Oyj
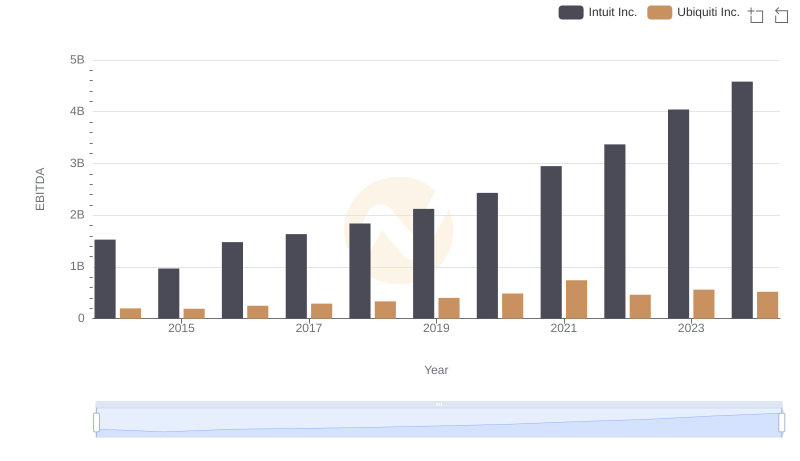
A Professional Review of EBITDA: Intuit Inc. Compared to Ubiquiti Inc.
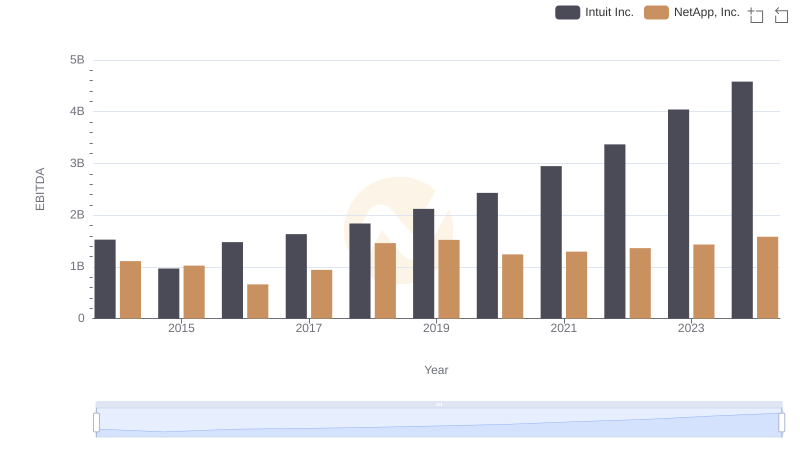
A Side-by-Side Analysis of EBITDA: Intuit Inc. and NetApp, Inc.

Intuit Inc. and Teledyne Technologies Incorporated: A Detailed Examination of EBITDA Performance
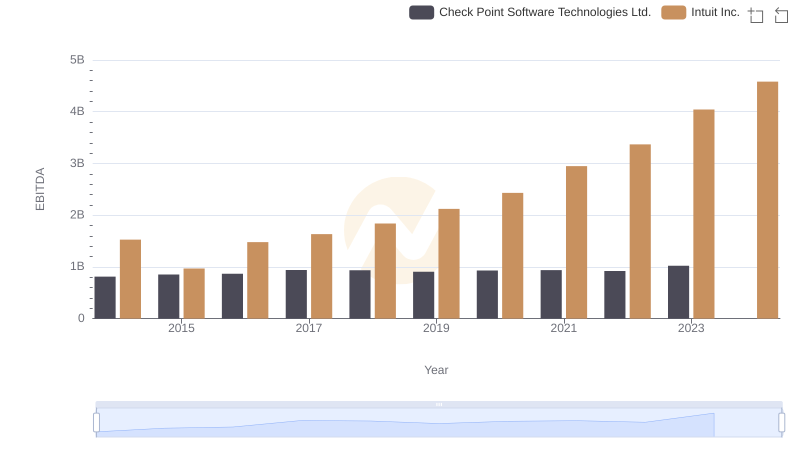
Professional EBITDA Benchmarking: Intuit Inc. vs Check Point Software Technologies Ltd.
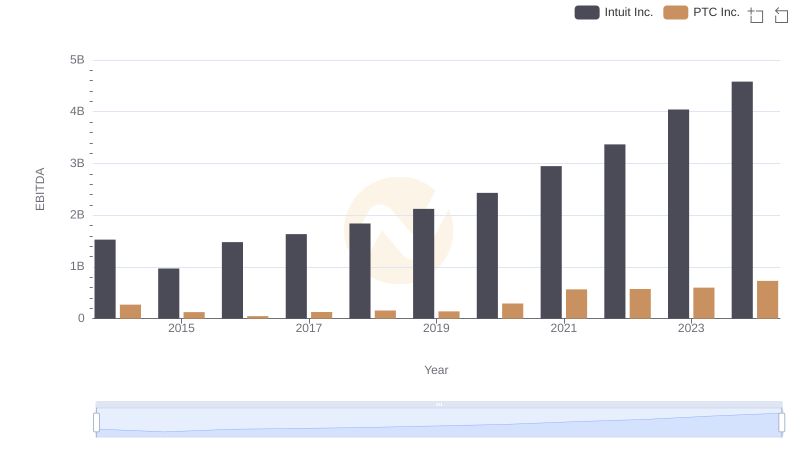
Intuit Inc. vs PTC Inc.: In-Depth EBITDA Performance Comparison
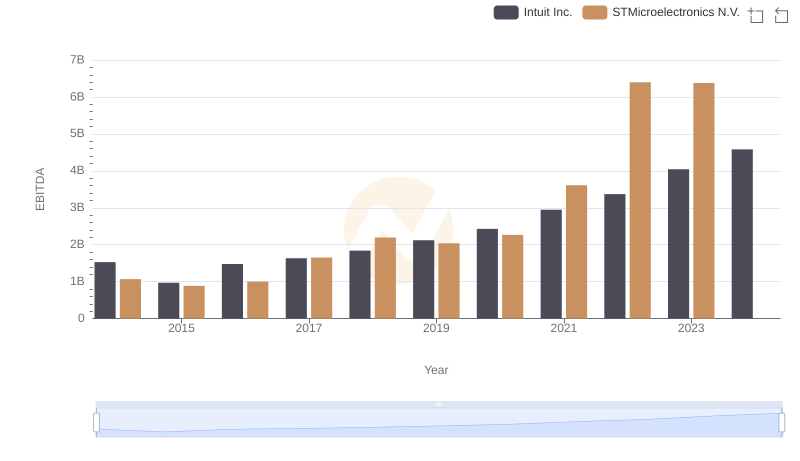
EBITDA Analysis: Evaluating Intuit Inc. Against STMicroelectronics N.V.