| __timestamp | Intuit Inc. | Teledyne Technologies Incorporated |
|---|---|---|
| Wednesday, January 1, 2014 | 1528000000 | 395400000 |
| Thursday, January 1, 2015 | 970000000 | 372500000 |
| Friday, January 1, 2016 | 1480000000 | 351700000 |
| Sunday, January 1, 2017 | 1634000000 | 436800000 |
| Monday, January 1, 2018 | 1839000000 | 540100000 |
| Tuesday, January 1, 2019 | 2121000000 | 610800000 |
| Wednesday, January 1, 2020 | 2430000000 | 604100000 |
| Friday, January 1, 2021 | 2948000000 | 982000000 |
| Saturday, January 1, 2022 | 3369000000 | 1335200000 |
| Sunday, January 1, 2023 | 4043000000 | 1360800000 |
| Monday, January 1, 2024 | 4581000000 |
Unveiling the hidden dimensions of data
In the ever-evolving landscape of financial performance, EBITDA serves as a crucial indicator of a company's operational efficiency. From 2014 to 2023, Intuit Inc. has demonstrated a remarkable growth trajectory, with its EBITDA increasing by approximately 200%. This growth is particularly notable in the last two years, where Intuit's EBITDA surged by nearly 35% from 2021 to 2023. In contrast, Teledyne Technologies Incorporated, while showing steady growth, has seen its EBITDA rise by about 245% over the same period, with a significant leap of 36% from 2021 to 2023. However, data for 2024 is missing, leaving room for speculation on future trends. This analysis highlights the dynamic nature of these companies' financial health, offering valuable insights for investors and stakeholders alike.
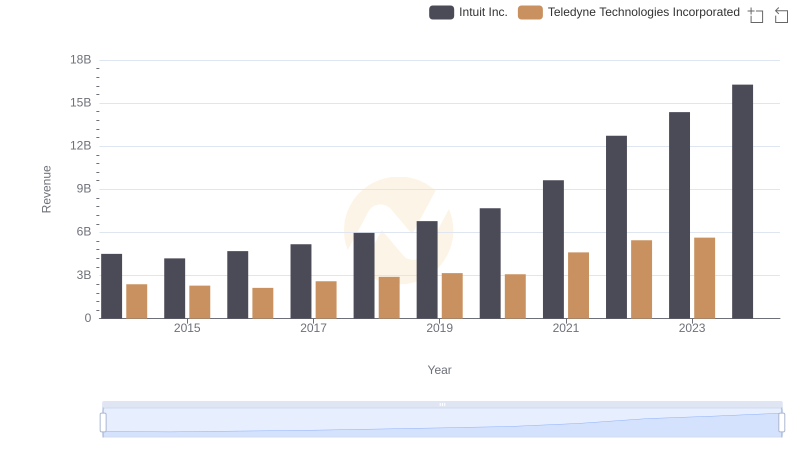
Annual Revenue Comparison: Intuit Inc. vs Teledyne Technologies Incorporated
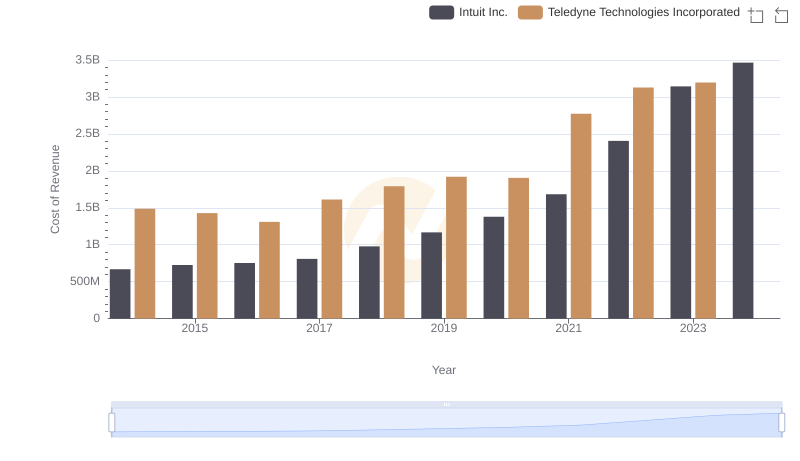
Intuit Inc. vs Teledyne Technologies Incorporated: Efficiency in Cost of Revenue Explored
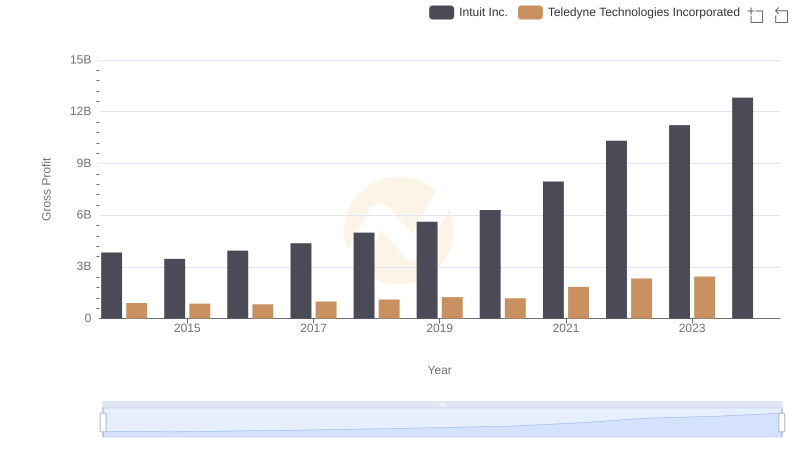
Intuit Inc. vs Teledyne Technologies Incorporated: A Gross Profit Performance Breakdown

Analyzing R&D Budgets: Intuit Inc. vs Teledyne Technologies Incorporated
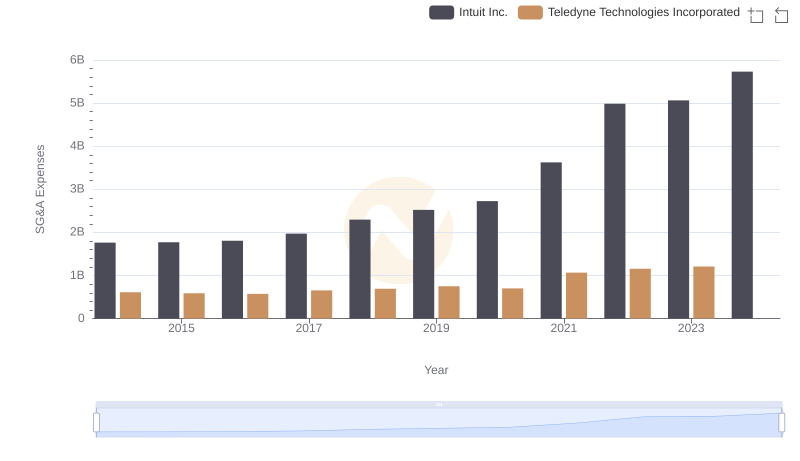
Breaking Down SG&A Expenses: Intuit Inc. vs Teledyne Technologies Incorporated
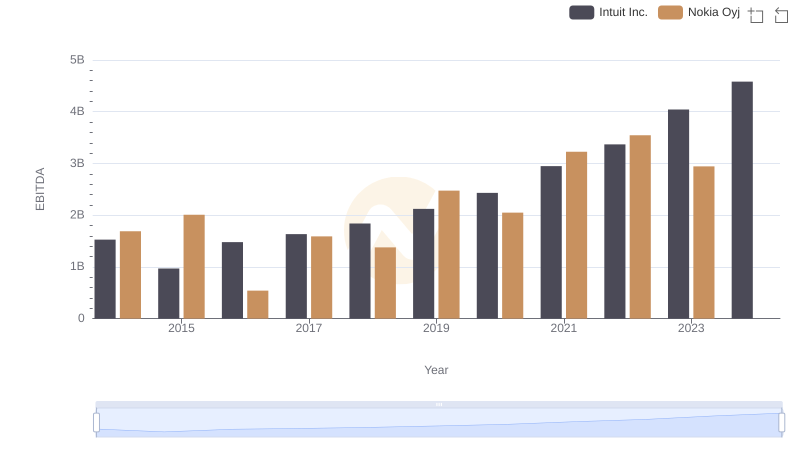
EBITDA Metrics Evaluated: Intuit Inc. vs Nokia Oyj
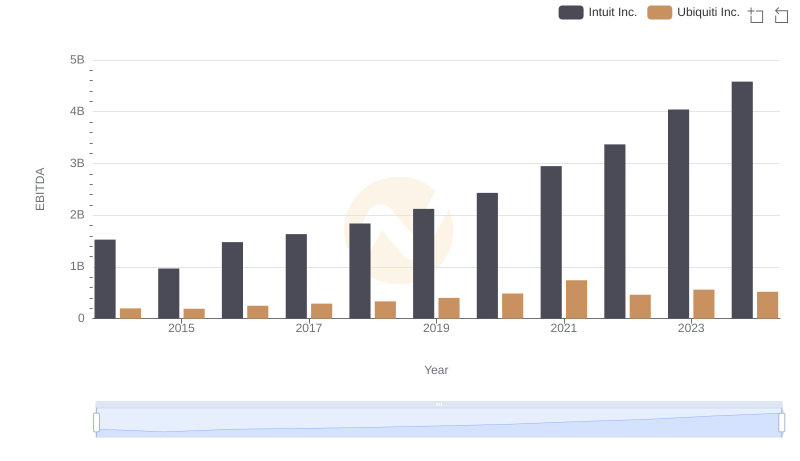
A Professional Review of EBITDA: Intuit Inc. Compared to Ubiquiti Inc.
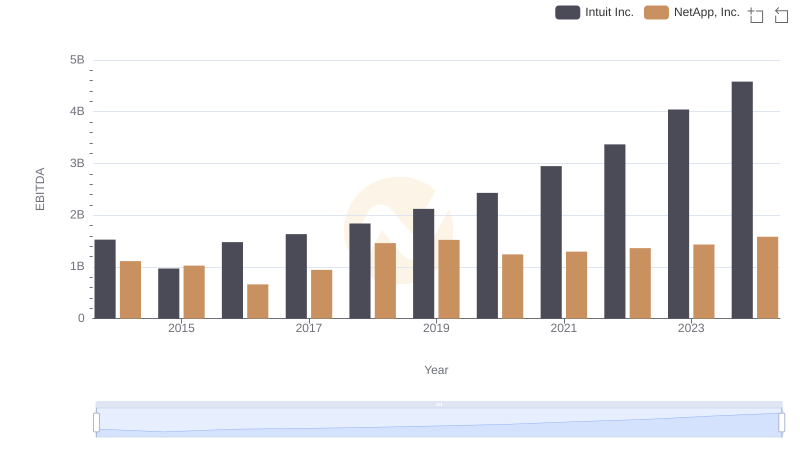
A Side-by-Side Analysis of EBITDA: Intuit Inc. and NetApp, Inc.
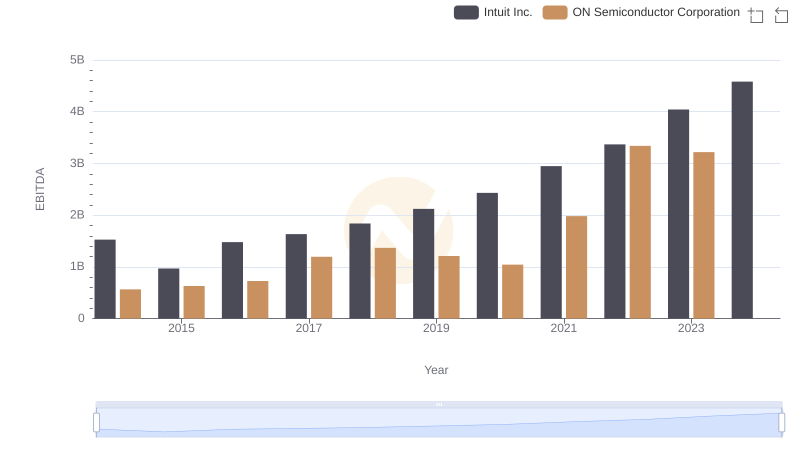
EBITDA Analysis: Evaluating Intuit Inc. Against ON Semiconductor Corporation
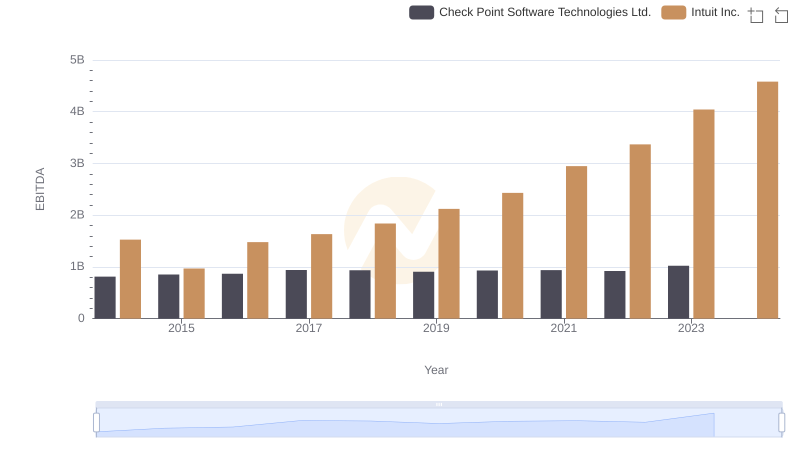
Professional EBITDA Benchmarking: Intuit Inc. vs Check Point Software Technologies Ltd.
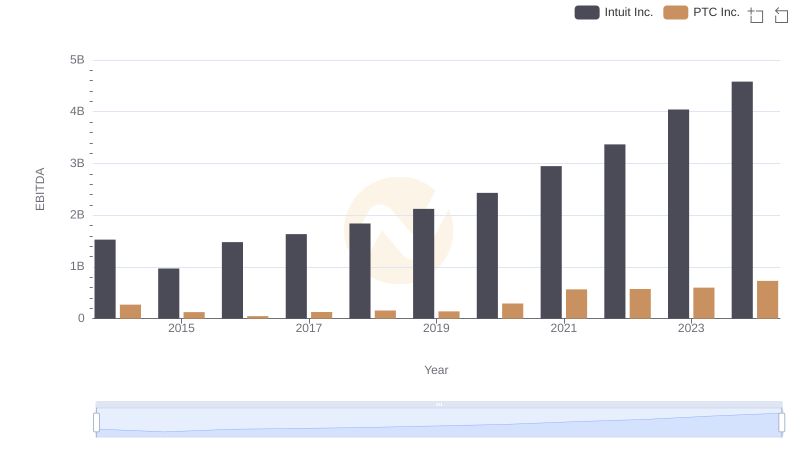
Intuit Inc. vs PTC Inc.: In-Depth EBITDA Performance Comparison
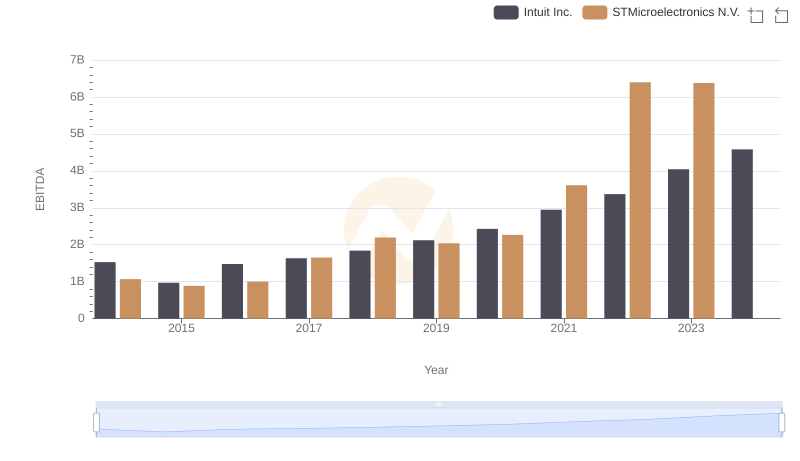
EBITDA Analysis: Evaluating Intuit Inc. Against STMicroelectronics N.V.