| __timestamp | Global Payments Inc. | Textron Inc. |
|---|---|---|
| Wednesday, January 1, 2014 | 2773718000 | 13878000000 |
| Thursday, January 1, 2015 | 2898150000 | 13423000000 |
| Friday, January 1, 2016 | 3370976000 | 13788000000 |
| Sunday, January 1, 2017 | 3975163000 | 14198000000 |
| Monday, January 1, 2018 | 3366366000 | 13972000000 |
| Tuesday, January 1, 2019 | 4911892000 | 13630000000 |
| Wednesday, January 1, 2020 | 7423558000 | 11651000000 |
| Friday, January 1, 2021 | 8523762000 | 12382000000 |
| Saturday, January 1, 2022 | 8975515000 | 12869000000 |
| Sunday, January 1, 2023 | 9654419000 | 13683000000 |
| Monday, January 1, 2024 | 10105894000 | 13702000000 |
Unleashing the power of data
In the ever-evolving landscape of global finance, understanding the revenue trajectories of industry giants like Global Payments Inc. and Textron Inc. offers invaluable insights. Over the past decade, Global Payments Inc. has demonstrated a remarkable revenue growth, surging from approximately $2.8 billion in 2014 to nearly $9.7 billion by 2023. This represents a staggering increase of over 240%, underscoring the company's strategic prowess in the financial services sector.
Conversely, Textron Inc., a leader in the aerospace and defense industry, has maintained a steady revenue stream, fluctuating around the $13 billion mark. Despite a slight dip in 2020, Textron's revenue rebounded, reaching $13.7 billion in 2023. This resilience highlights Textron's robust market position and adaptability.
While Global Payments Inc. experienced exponential growth, Textron's consistent performance reflects its stability in a competitive market. Missing data for 2024 suggests an opportunity for future analysis.
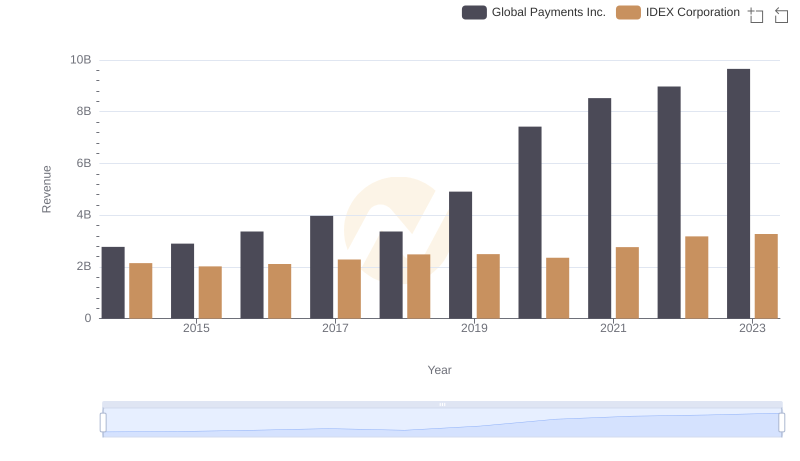
Comparing Revenue Performance: Global Payments Inc. or IDEX Corporation?
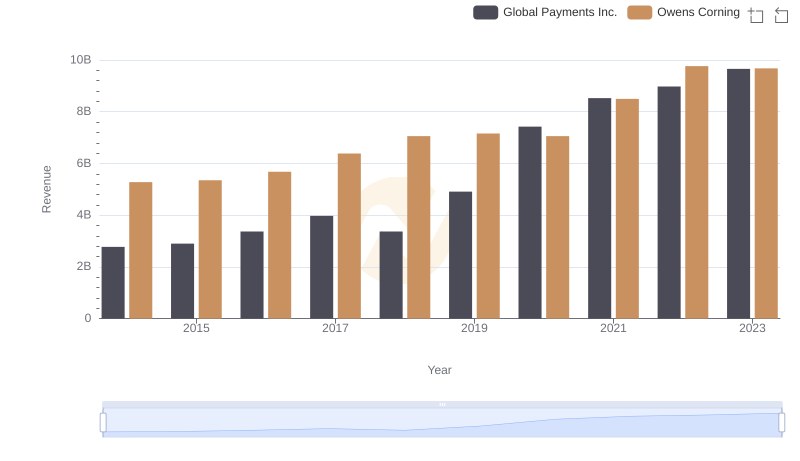
Global Payments Inc. or Owens Corning: Who Leads in Yearly Revenue?
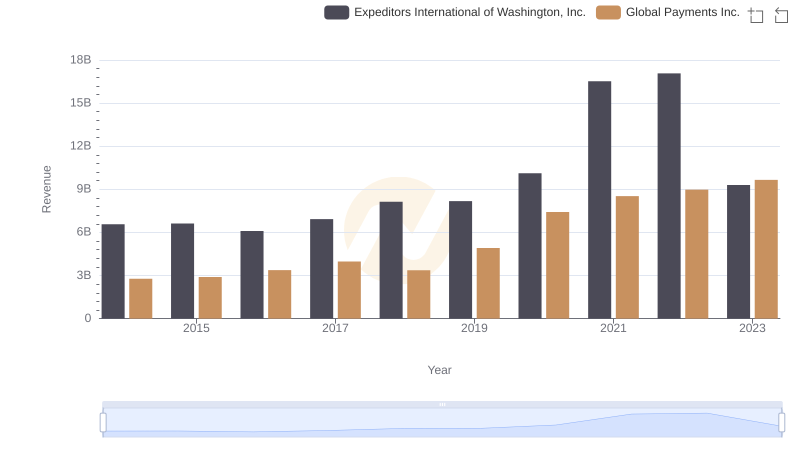
Global Payments Inc. or Expeditors International of Washington, Inc.: Who Leads in Yearly Revenue?
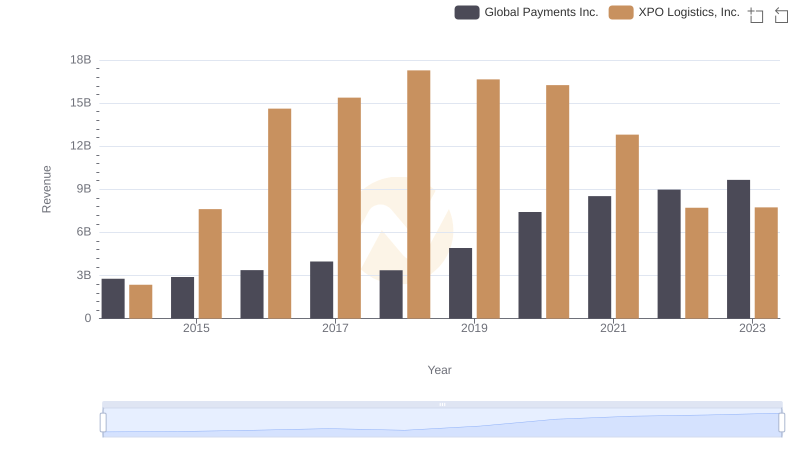
Breaking Down Revenue Trends: Global Payments Inc. vs XPO Logistics, Inc.
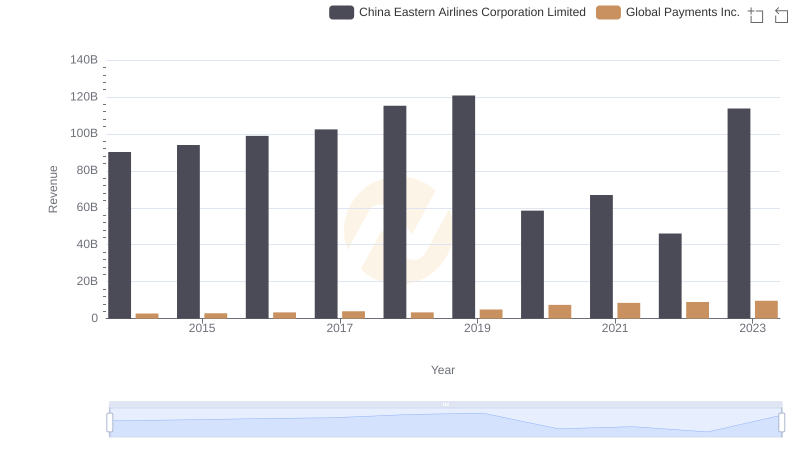
Who Generates More Revenue? Global Payments Inc. or China Eastern Airlines Corporation Limited
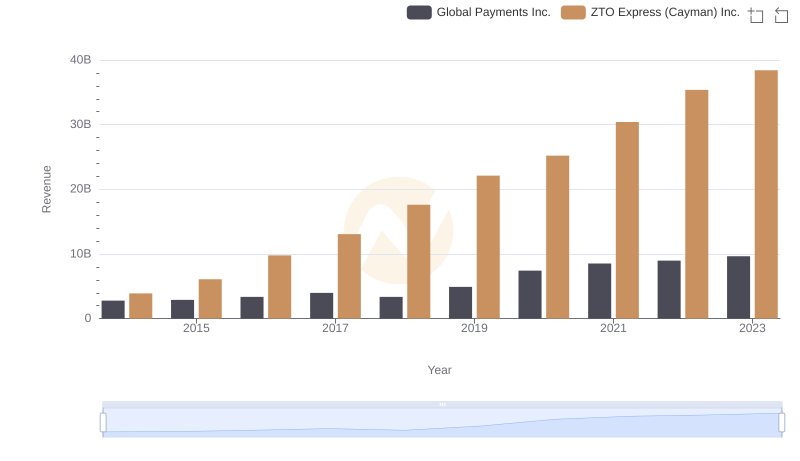
Who Generates More Revenue? Global Payments Inc. or ZTO Express (Cayman) Inc.
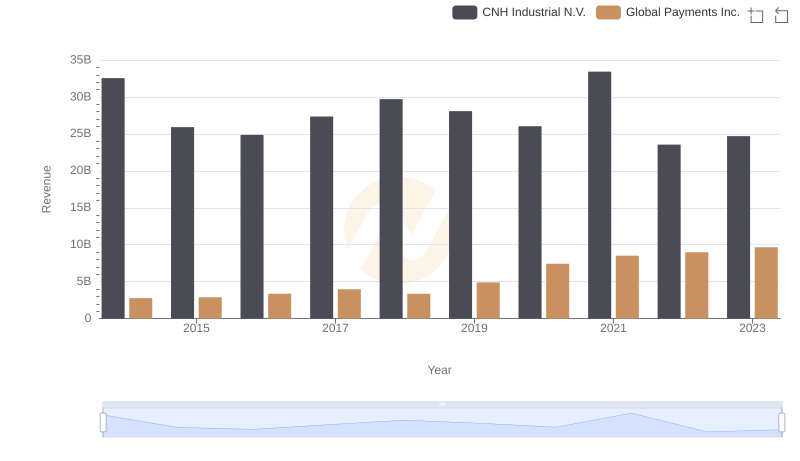
Revenue Insights: Global Payments Inc. and CNH Industrial N.V. Performance Compared
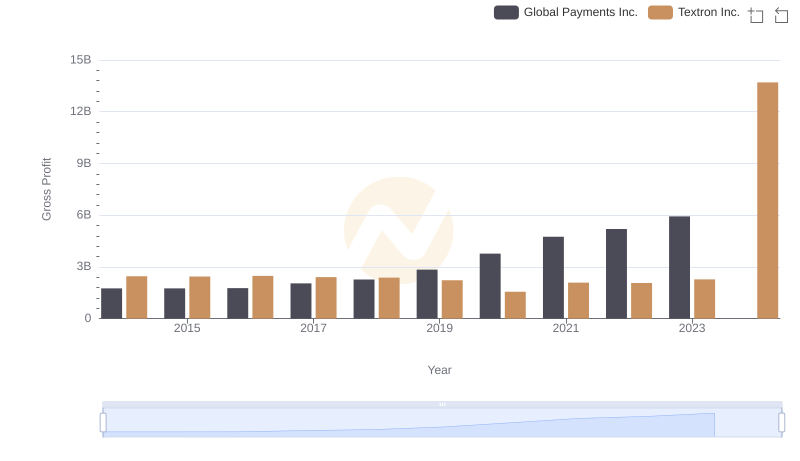
Key Insights on Gross Profit: Global Payments Inc. vs Textron Inc.
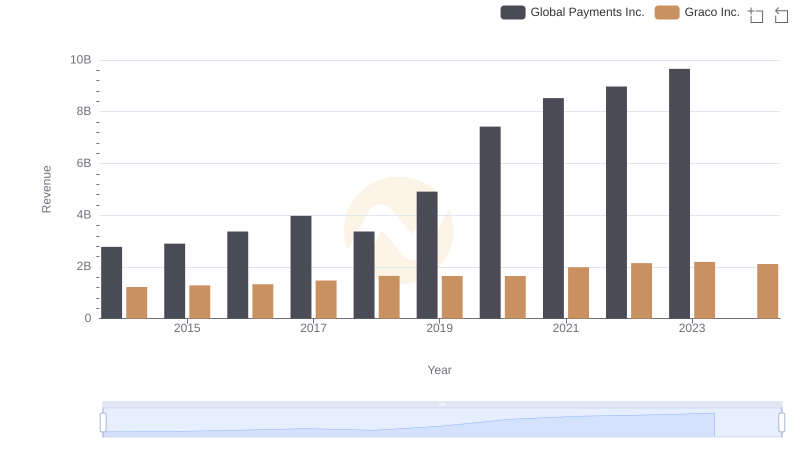
Revenue Showdown: Global Payments Inc. vs Graco Inc.
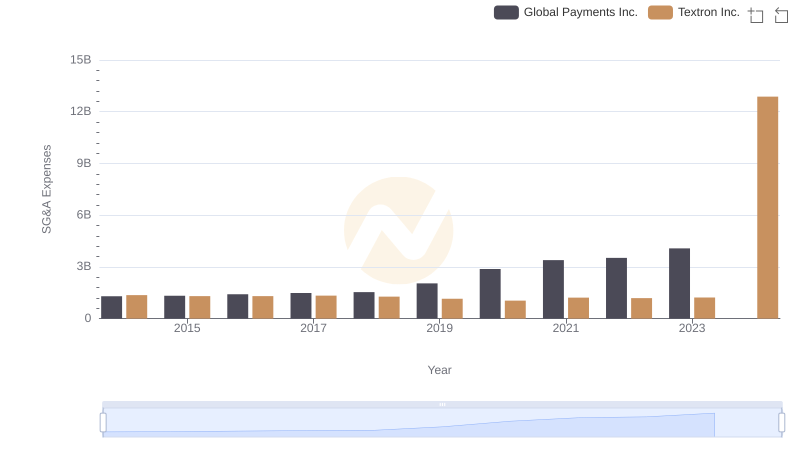
Cost Management Insights: SG&A Expenses for Global Payments Inc. and Textron Inc.
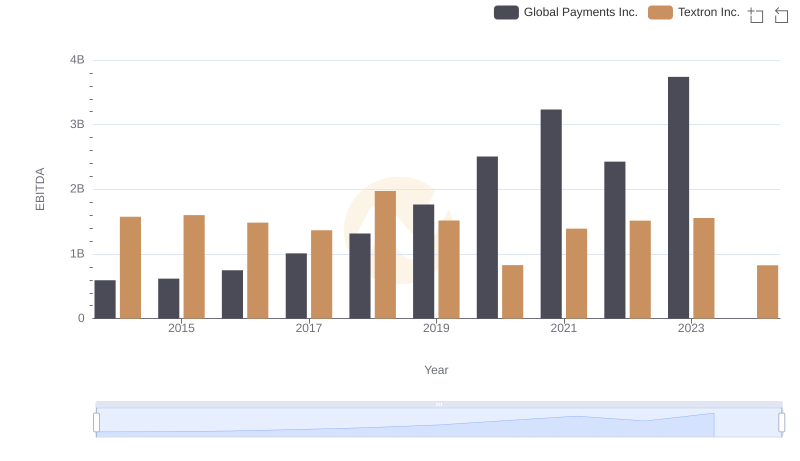
EBITDA Analysis: Evaluating Global Payments Inc. Against Textron Inc.