| __timestamp | Global Payments Inc. | Textron Inc. |
|---|---|---|
| Wednesday, January 1, 2014 | 1751611000 | 2457000000 |
| Thursday, January 1, 2015 | 1750511000 | 2444000000 |
| Friday, January 1, 2016 | 1767444000 | 2477000000 |
| Sunday, January 1, 2017 | 2047126000 | 2403000000 |
| Monday, January 1, 2018 | 2271352000 | 2378000000 |
| Tuesday, January 1, 2019 | 2838089000 | 2224000000 |
| Wednesday, January 1, 2020 | 3772831000 | 1557000000 |
| Friday, January 1, 2021 | 4750037000 | 2085000000 |
| Saturday, January 1, 2022 | 5196898000 | 2069000000 |
| Sunday, January 1, 2023 | 5926898000 | 2278000000 |
| Monday, January 1, 2024 | 6345778000 | 2502000000 |
Cracking the code
In the ever-evolving landscape of global finance and manufacturing, two industry titans, Global Payments Inc. and Textron Inc., have showcased intriguing trends in their gross profit margins over the past decade. From 2014 to 2023, Global Payments Inc. has seen a remarkable growth trajectory, with its gross profit surging by approximately 238%, peaking at nearly $5.93 billion in 2023. This growth underscores the company's robust expansion and strategic acquisitions in the financial services sector.
Conversely, Textron Inc., a leader in aerospace and defense, experienced a more modest increase, with its gross profit fluctuating but ultimately reaching a significant $13.7 billion in 2024. This spike, however, is an outlier, as the data for 2024 is incomplete. The contrasting paths of these companies highlight the dynamic nature of their respective industries, offering valuable insights for investors and market analysts alike.
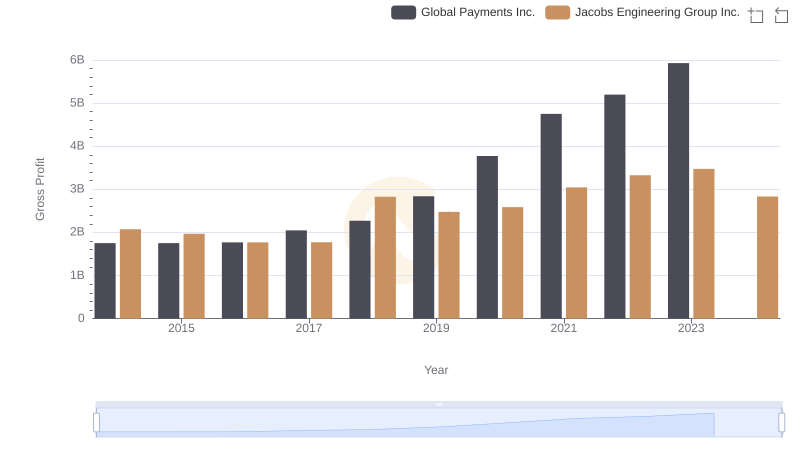
Global Payments Inc. vs Jacobs Engineering Group Inc.: A Gross Profit Performance Breakdown
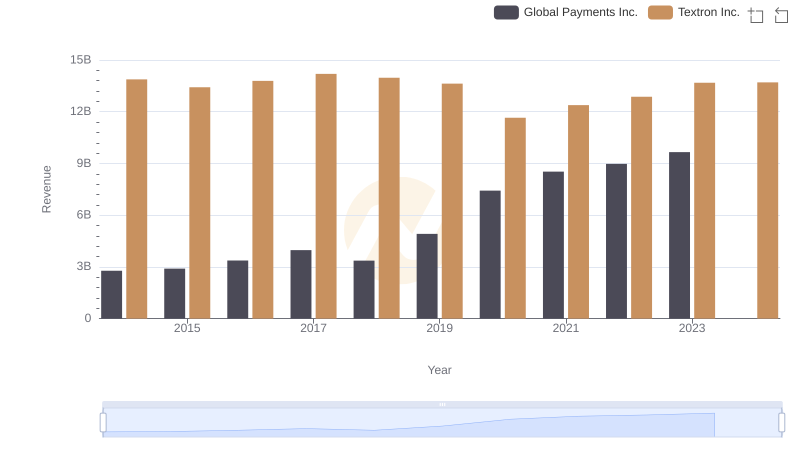
Global Payments Inc. and Textron Inc.: A Comprehensive Revenue Analysis
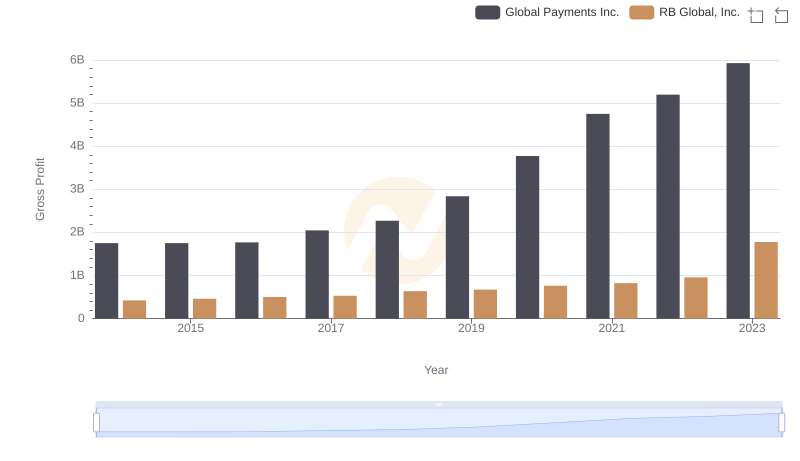
Gross Profit Comparison: Global Payments Inc. and RB Global, Inc. Trends
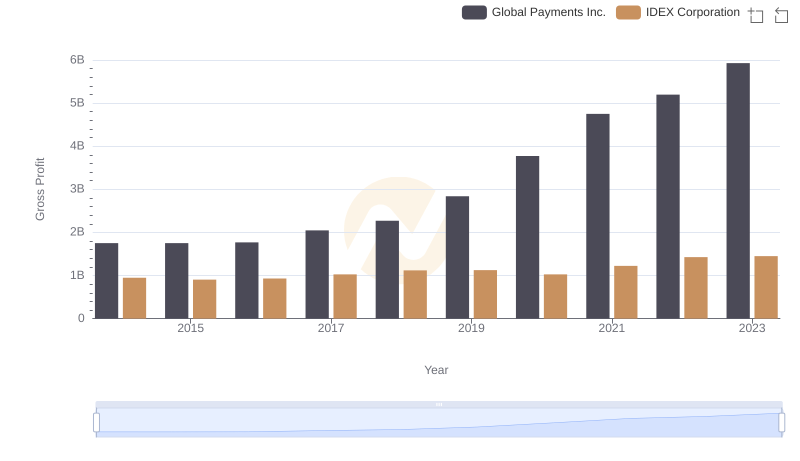
Gross Profit Comparison: Global Payments Inc. and IDEX Corporation Trends
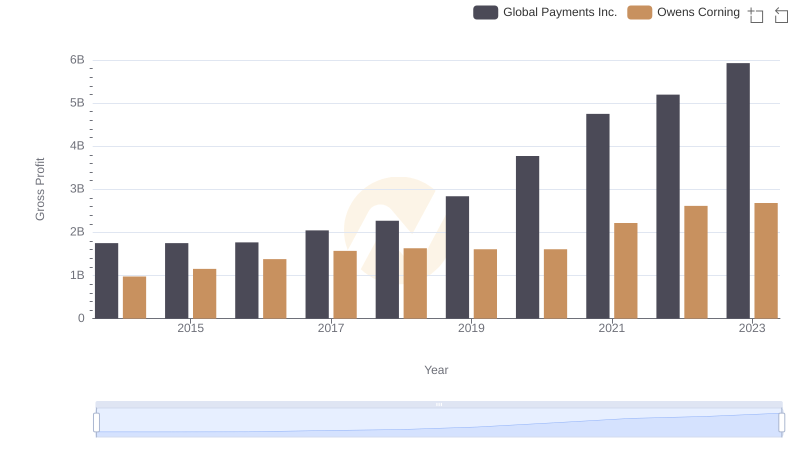
Global Payments Inc. and Owens Corning: A Detailed Gross Profit Analysis
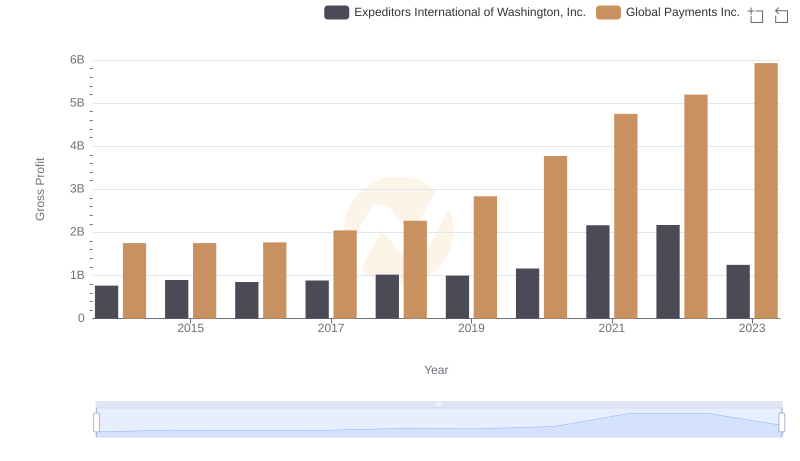
Gross Profit Trends Compared: Global Payments Inc. vs Expeditors International of Washington, Inc.
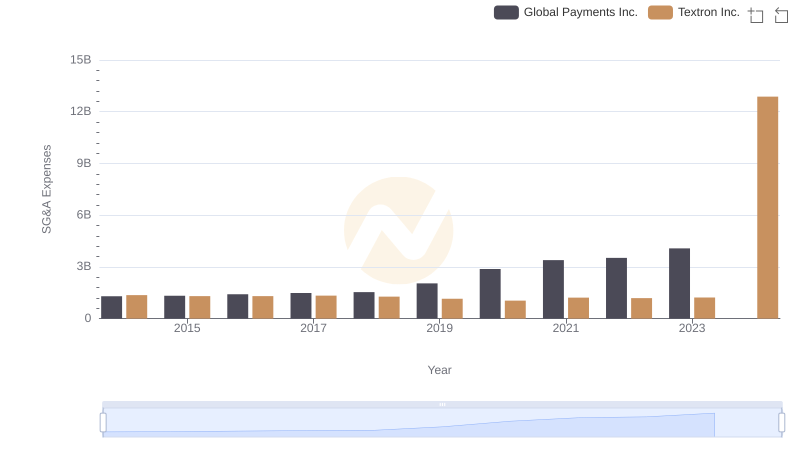
Cost Management Insights: SG&A Expenses for Global Payments Inc. and Textron Inc.
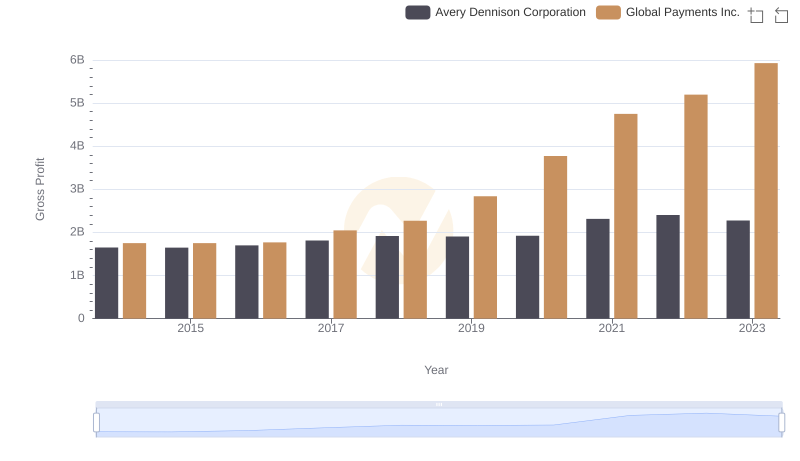
Global Payments Inc. vs Avery Dennison Corporation: A Gross Profit Performance Breakdown
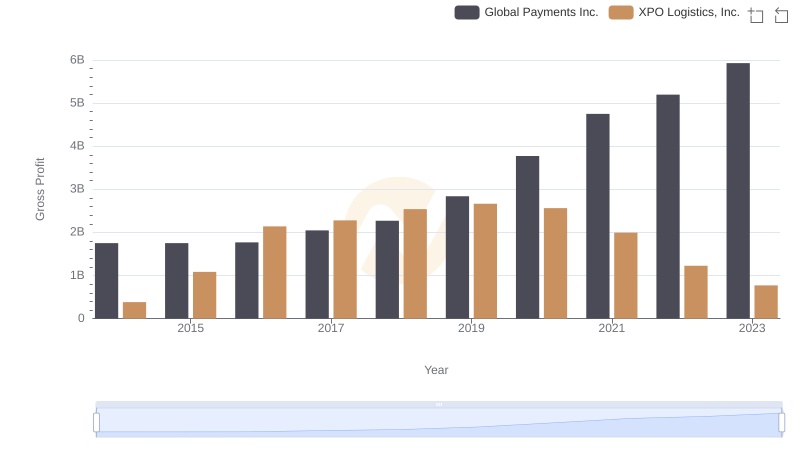
Gross Profit Analysis: Comparing Global Payments Inc. and XPO Logistics, Inc.
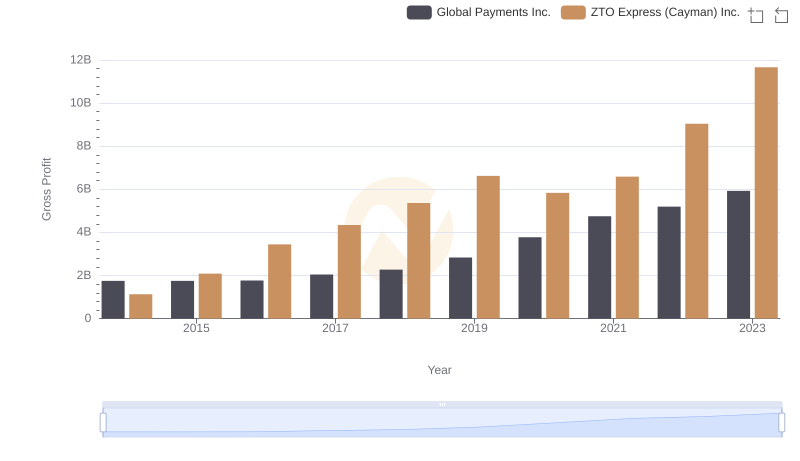
Global Payments Inc. vs ZTO Express (Cayman) Inc.: A Gross Profit Performance Breakdown
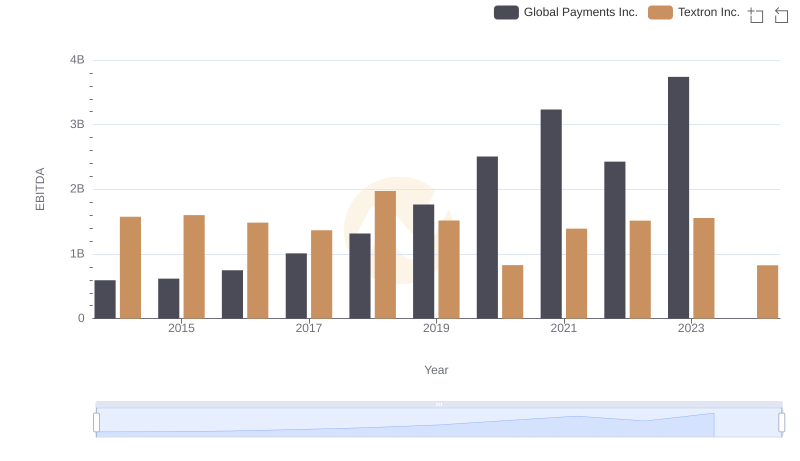
EBITDA Analysis: Evaluating Global Payments Inc. Against Textron Inc.