| __timestamp | EMCOR Group, Inc. | Expeditors International of Washington, Inc. |
|---|---|---|
| Wednesday, January 1, 2014 | 355858000 | 643940000 |
| Thursday, January 1, 2015 | 362095000 | 767496000 |
| Friday, January 1, 2016 | 395913000 | 716959000 |
| Sunday, January 1, 2017 | 478459000 | 749570000 |
| Monday, January 1, 2018 | 489954000 | 850582000 |
| Tuesday, January 1, 2019 | 556055000 | 817642000 |
| Wednesday, January 1, 2020 | 601449000 | 1013523000 |
| Friday, January 1, 2021 | 646861000 | 1975928000 |
| Saturday, January 1, 2022 | 682399000 | 1916506000 |
| Sunday, January 1, 2023 | 1009017000 | 1087588000 |
| Monday, January 1, 2024 | 1154330000 |
In pursuit of knowledge
In the ever-evolving landscape of the U.S. stock market, EMCOR Group, Inc. and Expeditors International of Washington, Inc. have demonstrated remarkable EBITDA growth over the past decade. From 2014 to 2023, EMCOR's EBITDA surged by approximately 183%, while Expeditors saw a 69% increase. This growth trajectory highlights EMCOR's robust operational efficiency and strategic initiatives, particularly in the construction and facilities services sector.
Expeditors, a leader in logistics and freight forwarding, experienced its most significant EBITDA spike in 2021, reaching nearly double its 2020 figures. This surge underscores the company's adaptability and resilience in navigating global supply chain challenges. As of 2023, both companies have shown strong financial health, with EMCOR's EBITDA reaching parity with Expeditors, a testament to its aggressive growth strategy.
Investors and market analysts should keep a keen eye on these industry giants as they continue to shape their respective sectors.
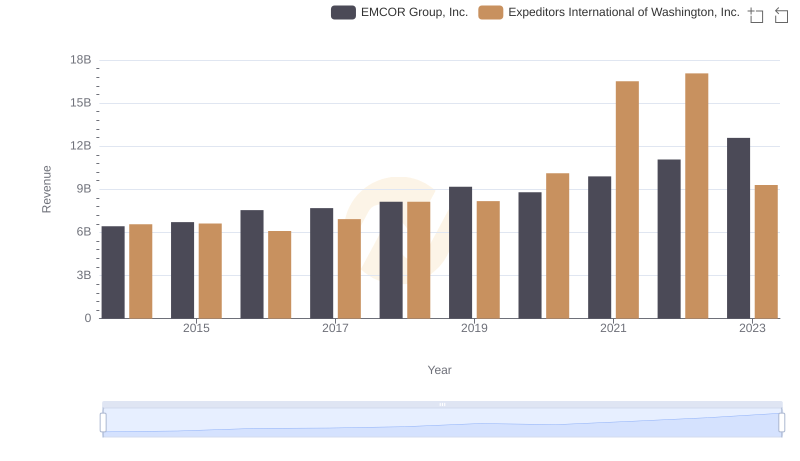
EMCOR Group, Inc. or Expeditors International of Washington, Inc.: Who Leads in Yearly Revenue?
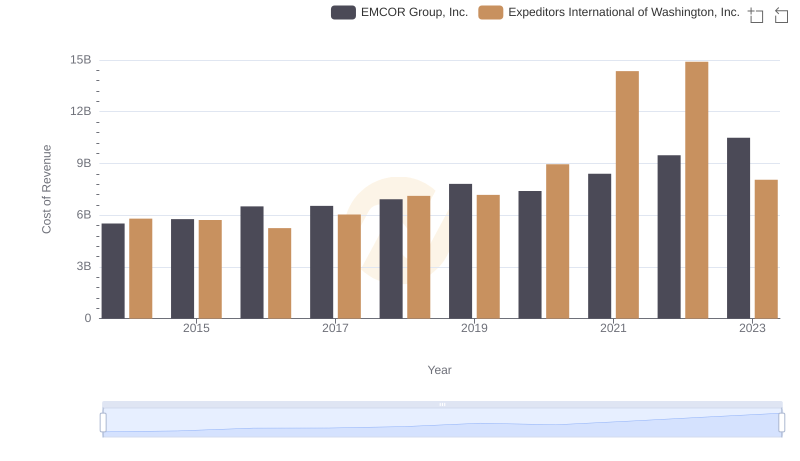
Cost of Revenue: Key Insights for EMCOR Group, Inc. and Expeditors International of Washington, Inc.
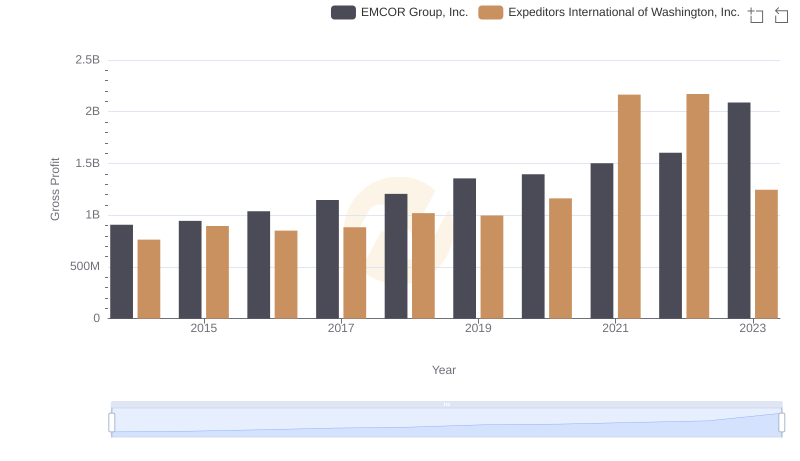
Gross Profit Analysis: Comparing EMCOR Group, Inc. and Expeditors International of Washington, Inc.
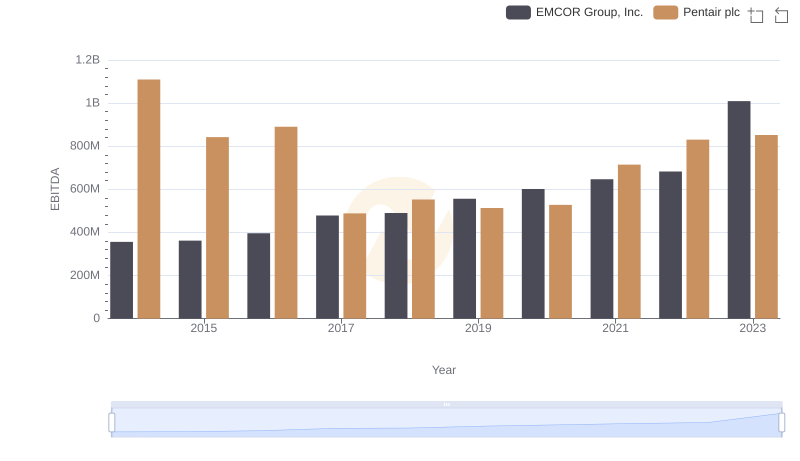
EBITDA Analysis: Evaluating EMCOR Group, Inc. Against Pentair plc
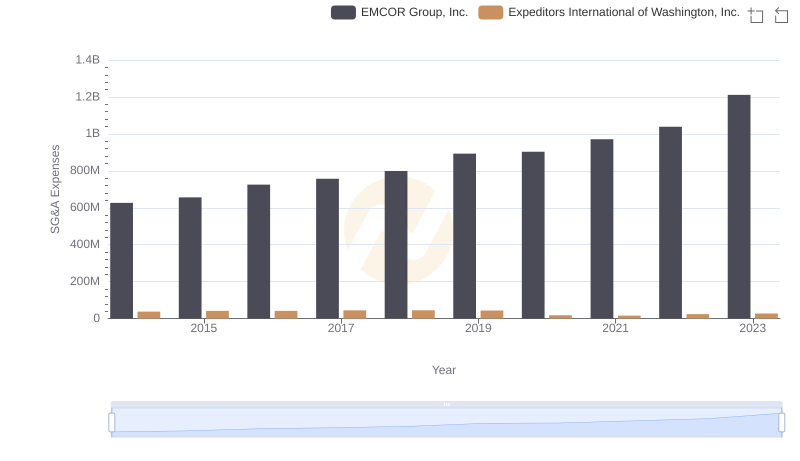
EMCOR Group, Inc. and Expeditors International of Washington, Inc.: SG&A Spending Patterns Compared
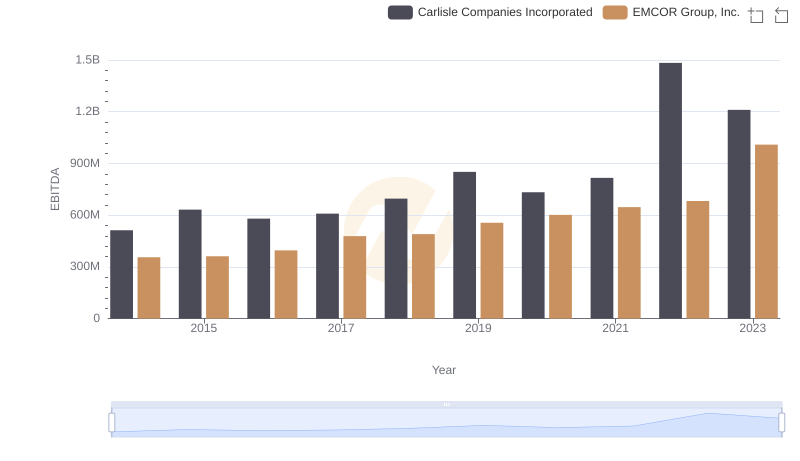
EMCOR Group, Inc. and Carlisle Companies Incorporated: A Detailed Examination of EBITDA Performance
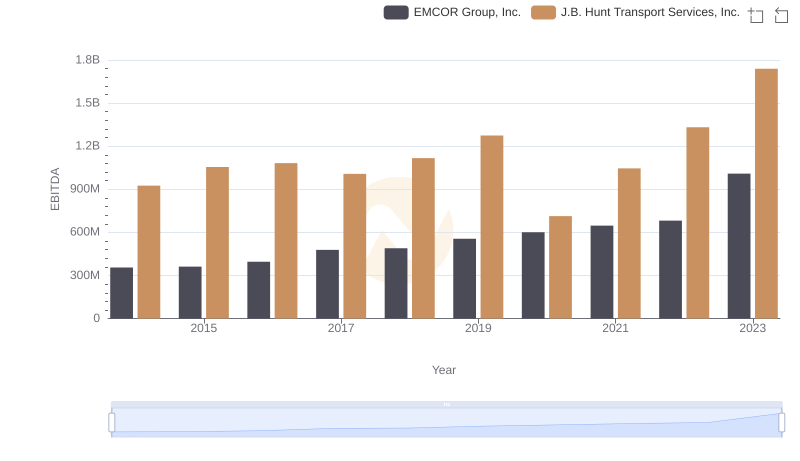
Comparative EBITDA Analysis: EMCOR Group, Inc. vs J.B. Hunt Transport Services, Inc.
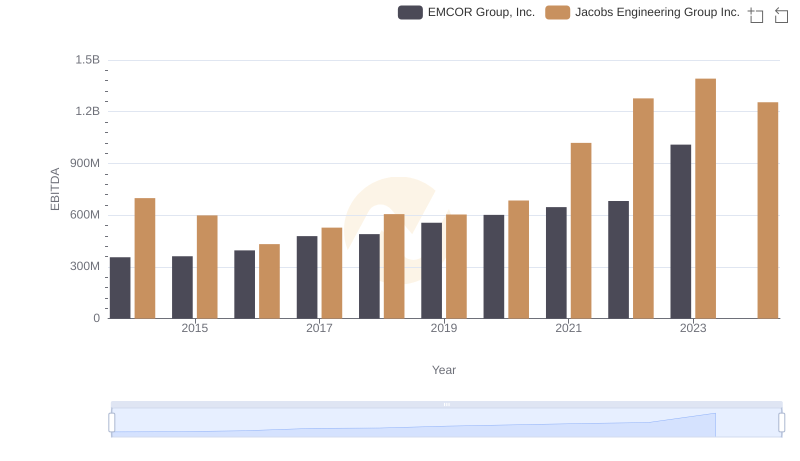
Comparative EBITDA Analysis: EMCOR Group, Inc. vs Jacobs Engineering Group Inc.
EBITDA Performance Review: EMCOR Group, Inc. vs IDEX Corporation
A Professional Review of EBITDA: EMCOR Group, Inc. Compared to Booz Allen Hamilton Holding Corporation
EBITDA Analysis: Evaluating EMCOR Group, Inc. Against Textron Inc.