| __timestamp | EMCOR Group, Inc. | Expeditors International of Washington, Inc. |
|---|---|---|
| Wednesday, January 1, 2014 | 626478000 | 38125000 |
| Thursday, January 1, 2015 | 656573000 | 41990000 |
| Friday, January 1, 2016 | 725538000 | 41763000 |
| Sunday, January 1, 2017 | 757062000 | 44290000 |
| Monday, January 1, 2018 | 799157000 | 45346000 |
| Tuesday, January 1, 2019 | 893453000 | 44002000 |
| Wednesday, January 1, 2020 | 903584000 | 18436000 |
| Friday, January 1, 2021 | 970937000 | 16026000 |
| Saturday, January 1, 2022 | 1038717000 | 24293000 |
| Sunday, January 1, 2023 | 1211233000 | 27913000 |
| Monday, January 1, 2024 | 33331000 |
Data in motion
In the ever-evolving landscape of corporate finance, understanding the spending patterns of industry leaders can offer valuable insights. This analysis delves into the Selling, General, and Administrative (SG&A) expenses of EMCOR Group, Inc. and Expeditors International of Washington, Inc. over the past decade. From 2014 to 2023, EMCOR Group, Inc. has seen a steady increase in SG&A expenses, growing by approximately 93%, reflecting its expanding operations and strategic investments. In contrast, Expeditors International of Washington, Inc. experienced a more volatile pattern, with a notable dip in 2020, followed by a gradual recovery. By 2023, their SG&A expenses had decreased by about 27% compared to 2014. This divergence highlights the distinct operational strategies and market responses of these two companies, offering a fascinating glimpse into their financial management and adaptability in a dynamic economic environment.
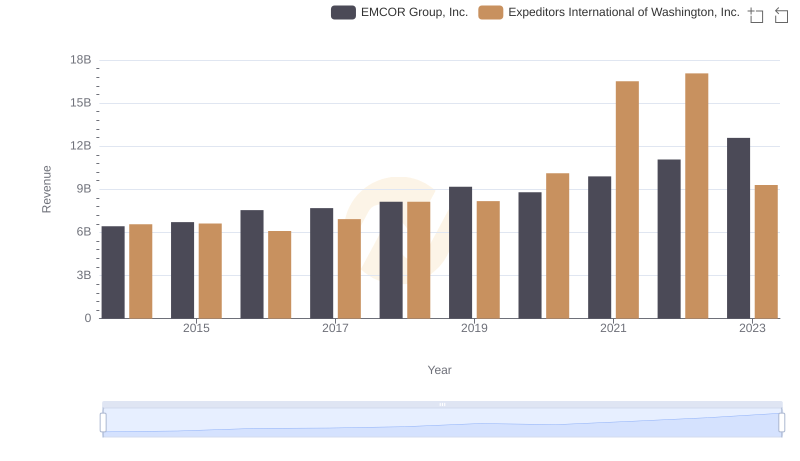
EMCOR Group, Inc. or Expeditors International of Washington, Inc.: Who Leads in Yearly Revenue?
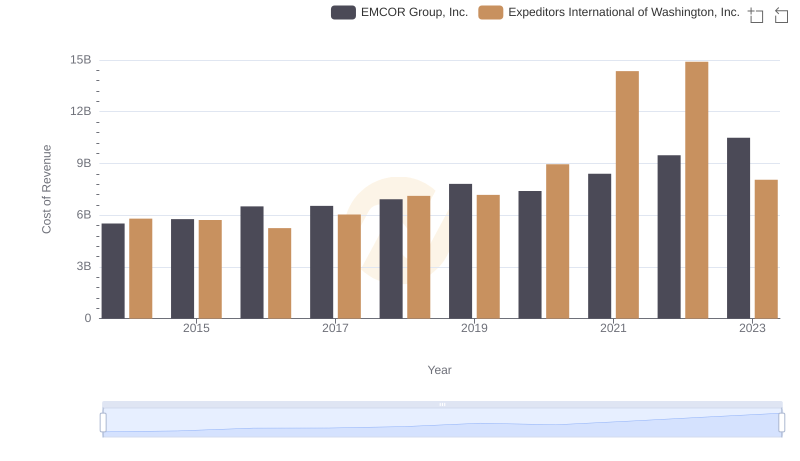
Cost of Revenue: Key Insights for EMCOR Group, Inc. and Expeditors International of Washington, Inc.
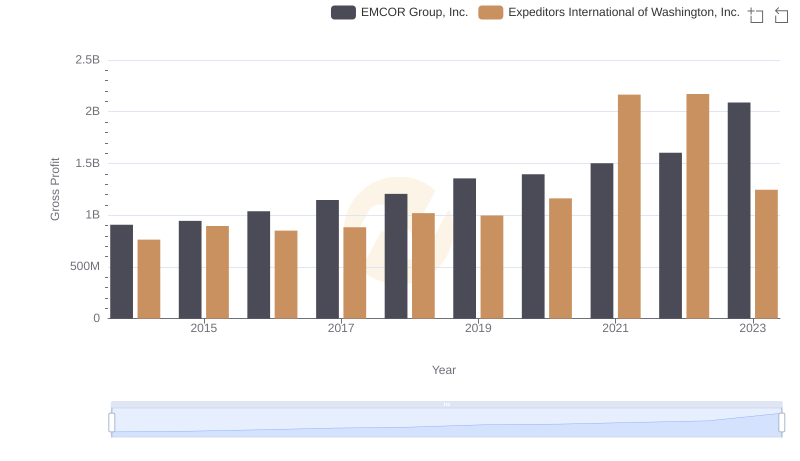
Gross Profit Analysis: Comparing EMCOR Group, Inc. and Expeditors International of Washington, Inc.
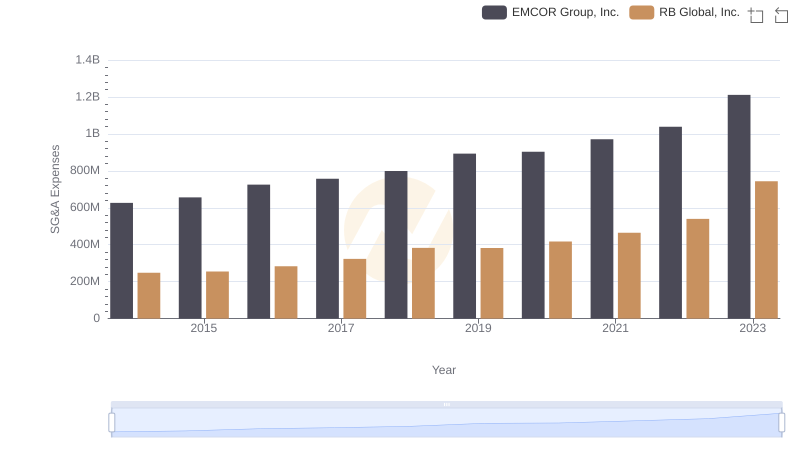
EMCOR Group, Inc. and RB Global, Inc.: SG&A Spending Patterns Compared
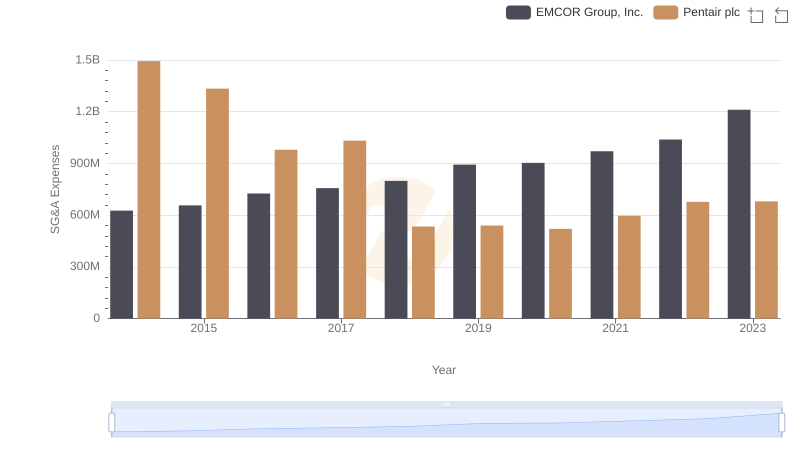
EMCOR Group, Inc. and Pentair plc: SG&A Spending Patterns Compared
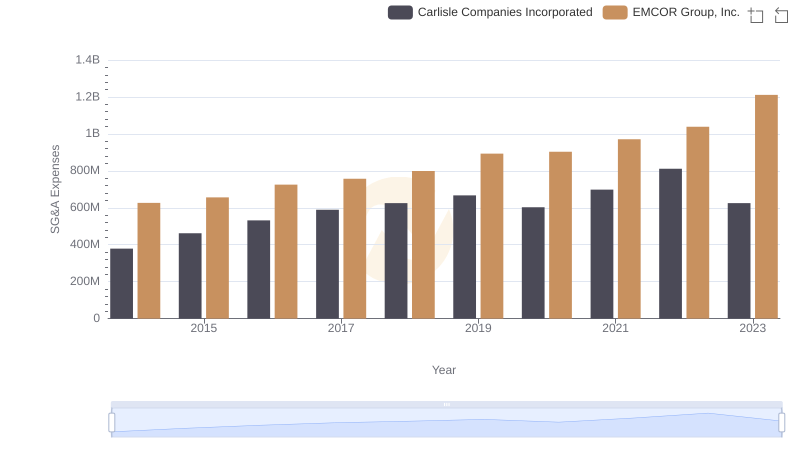
Breaking Down SG&A Expenses: EMCOR Group, Inc. vs Carlisle Companies Incorporated
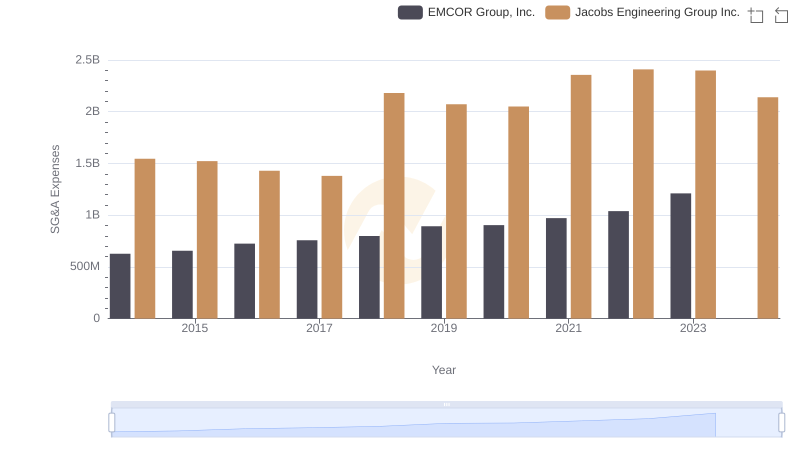
Selling, General, and Administrative Costs: EMCOR Group, Inc. vs Jacobs Engineering Group Inc.
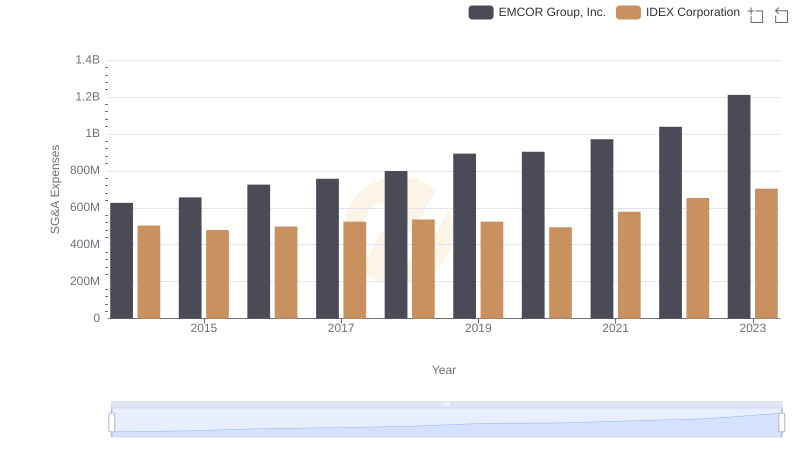
Breaking Down SG&A Expenses: EMCOR Group, Inc. vs IDEX Corporation
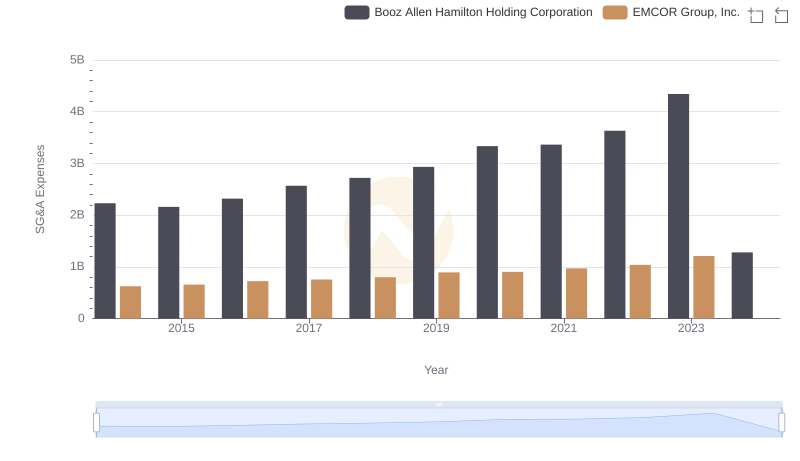
EMCOR Group, Inc. vs Booz Allen Hamilton Holding Corporation: SG&A Expense Trends
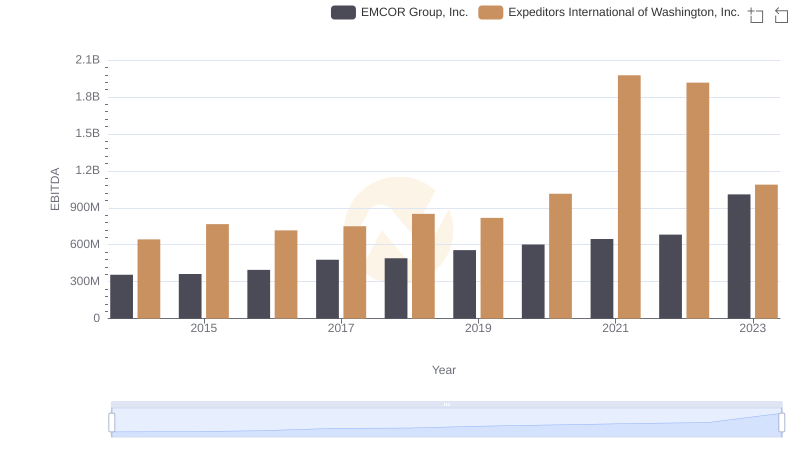
EBITDA Analysis: Evaluating EMCOR Group, Inc. Against Expeditors International of Washington, Inc.