| __timestamp | Carlisle Companies Incorporated | EMCOR Group, Inc. |
|---|---|---|
| Wednesday, January 1, 2014 | 512300000 | 355858000 |
| Thursday, January 1, 2015 | 631900000 | 362095000 |
| Friday, January 1, 2016 | 580200000 | 395913000 |
| Sunday, January 1, 2017 | 609300000 | 478459000 |
| Monday, January 1, 2018 | 696100000 | 489954000 |
| Tuesday, January 1, 2019 | 851000000 | 556055000 |
| Wednesday, January 1, 2020 | 733100000 | 601449000 |
| Friday, January 1, 2021 | 816100000 | 646861000 |
| Saturday, January 1, 2022 | 1483400000 | 682399000 |
| Sunday, January 1, 2023 | 1210700000 | 1009017000 |
| Monday, January 1, 2024 | 1356800000 |
Unleashing the power of data
In the ever-evolving landscape of the construction and manufacturing sectors, understanding financial performance is crucial. This analysis delves into the EBITDA trends of EMCOR Group, Inc. and Carlisle Companies Incorporated from 2014 to 2023. Over this period, Carlisle Companies demonstrated a robust growth trajectory, with EBITDA increasing by approximately 136%, peaking in 2022. In contrast, EMCOR Group's EBITDA grew by about 183%, reaching its zenith in 2023.
This financial journey highlights the dynamic nature of these industries, where strategic decisions and market conditions play pivotal roles in shaping company fortunes.
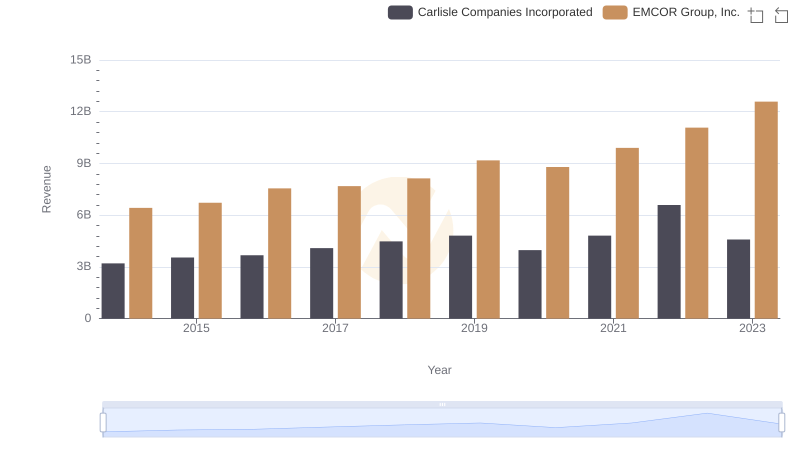
EMCOR Group, Inc. or Carlisle Companies Incorporated: Who Leads in Yearly Revenue?
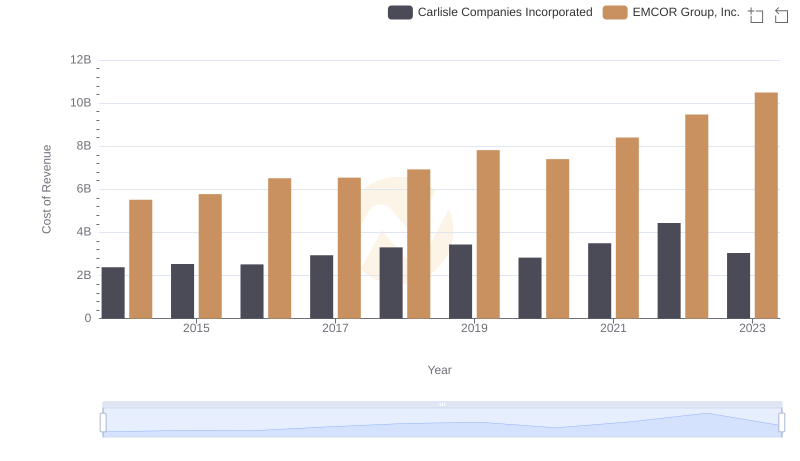
Comparing Cost of Revenue Efficiency: EMCOR Group, Inc. vs Carlisle Companies Incorporated
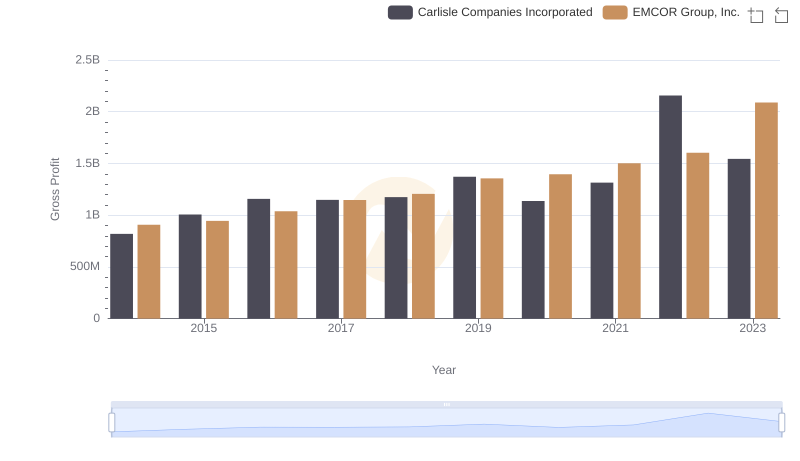
Gross Profit Trends Compared: EMCOR Group, Inc. vs Carlisle Companies Incorporated
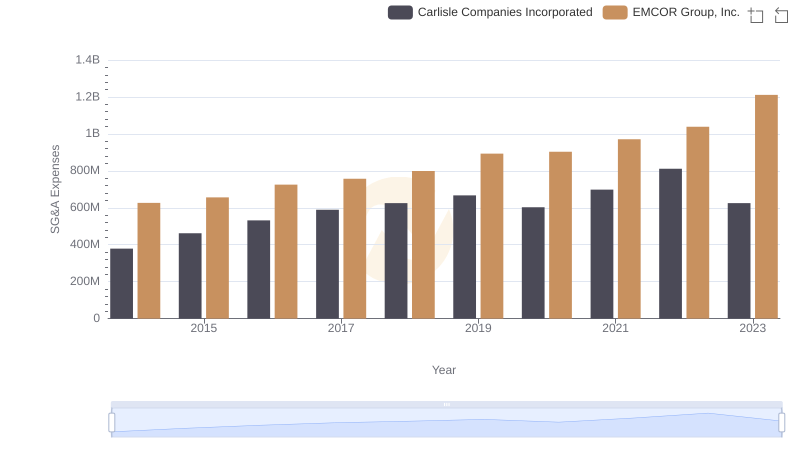
Breaking Down SG&A Expenses: EMCOR Group, Inc. vs Carlisle Companies Incorporated
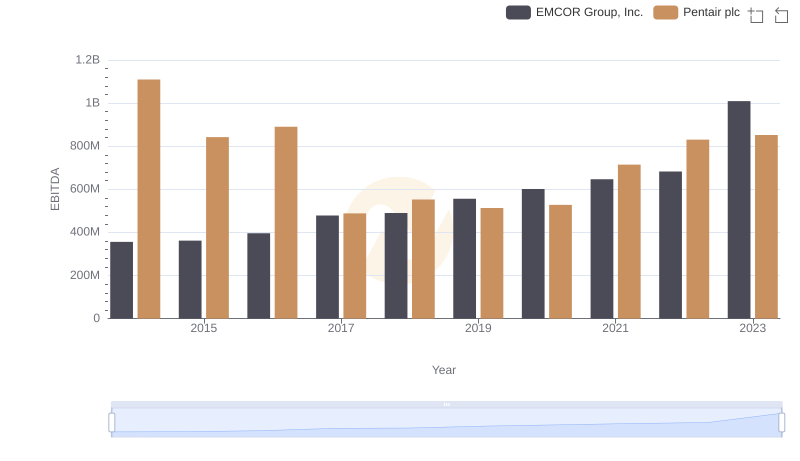
EBITDA Analysis: Evaluating EMCOR Group, Inc. Against Pentair plc
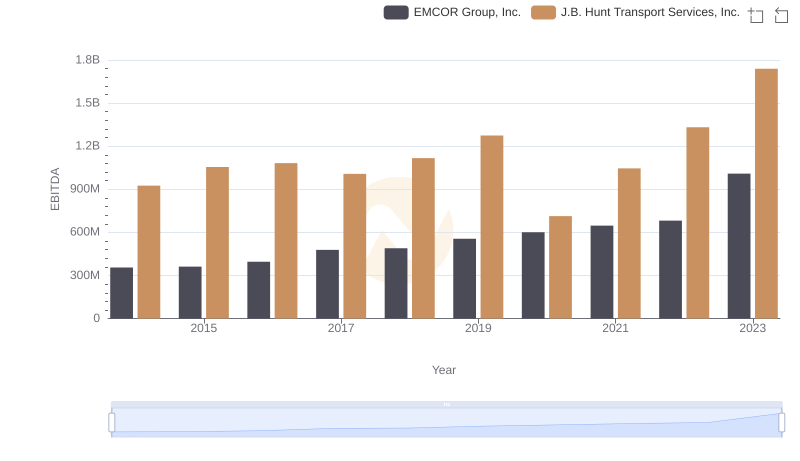
Comparative EBITDA Analysis: EMCOR Group, Inc. vs J.B. Hunt Transport Services, Inc.
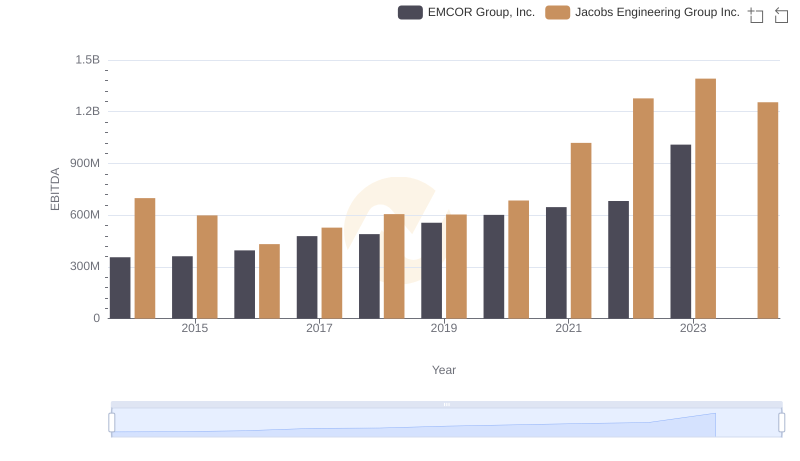
Comparative EBITDA Analysis: EMCOR Group, Inc. vs Jacobs Engineering Group Inc.
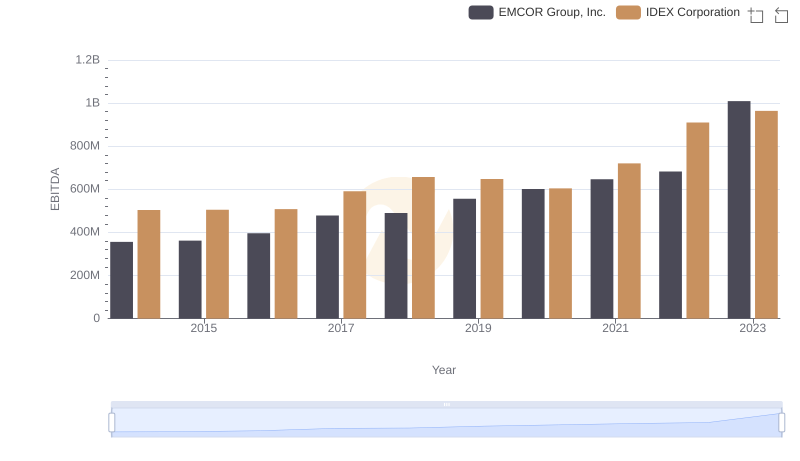
EBITDA Performance Review: EMCOR Group, Inc. vs IDEX Corporation
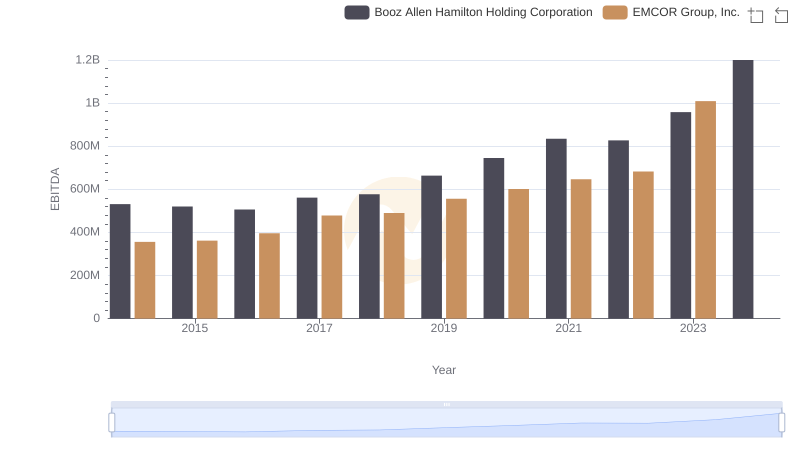
A Professional Review of EBITDA: EMCOR Group, Inc. Compared to Booz Allen Hamilton Holding Corporation
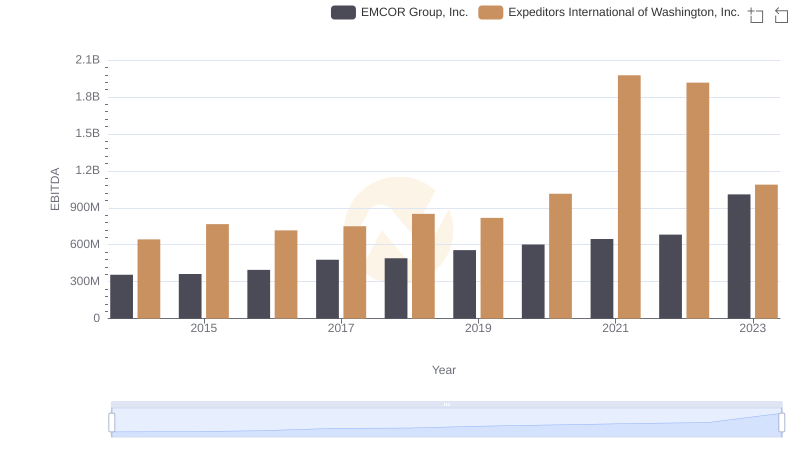
EBITDA Analysis: Evaluating EMCOR Group, Inc. Against Expeditors International of Washington, Inc.