| __timestamp | EMCOR Group, Inc. | Jacobs Engineering Group Inc. |
|---|---|---|
| Wednesday, January 1, 2014 | 355858000 | 699015000 |
| Thursday, January 1, 2015 | 362095000 | 598932000 |
| Friday, January 1, 2016 | 395913000 | 431954000 |
| Sunday, January 1, 2017 | 478459000 | 527765000 |
| Monday, January 1, 2018 | 489954000 | 606328000 |
| Tuesday, January 1, 2019 | 556055000 | 604075000 |
| Wednesday, January 1, 2020 | 601449000 | 685042000 |
| Friday, January 1, 2021 | 646861000 | 1019116000 |
| Saturday, January 1, 2022 | 682399000 | 1277649000 |
| Sunday, January 1, 2023 | 1009017000 | 1392039000 |
| Monday, January 1, 2024 | 1255083000 |
Unleashing insights
In the competitive landscape of engineering and construction, EMCOR Group, Inc. and Jacobs Engineering Group Inc. have demonstrated remarkable EBITDA growth over the past decade. From 2014 to 2023, EMCOR's EBITDA surged by approximately 183%, peaking at over $1 billion in 2023. Meanwhile, Jacobs Engineering showcased a robust 99% increase, reaching nearly $1.4 billion in the same year.
This analysis highlights the dynamic nature of the industry and the strategic maneuvers by these giants to sustain growth.
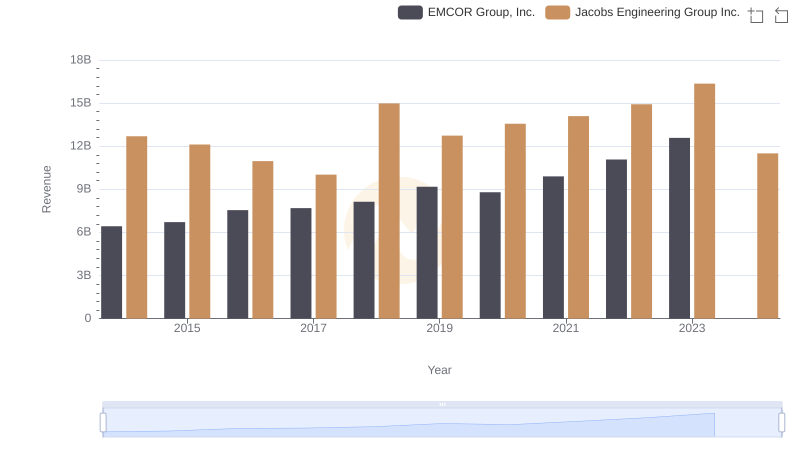
EMCOR Group, Inc. vs Jacobs Engineering Group Inc.: Examining Key Revenue Metrics
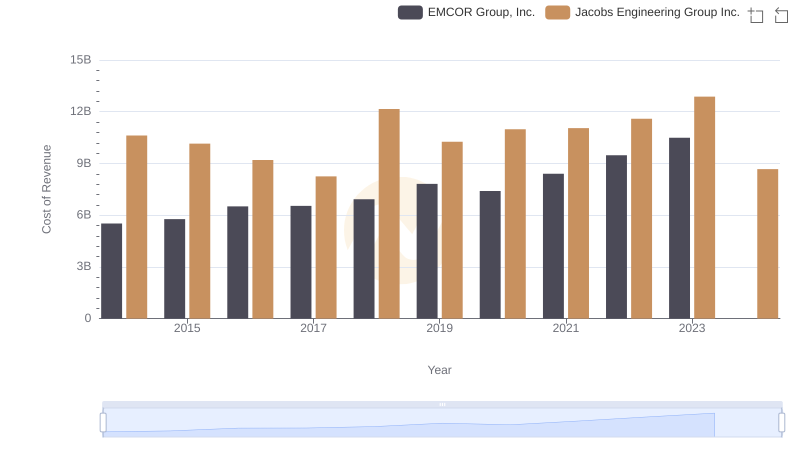
EMCOR Group, Inc. vs Jacobs Engineering Group Inc.: Efficiency in Cost of Revenue Explored
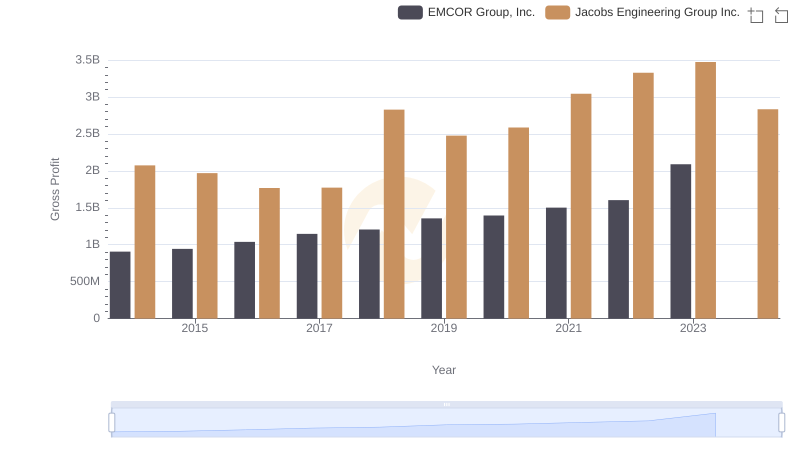
Who Generates Higher Gross Profit? EMCOR Group, Inc. or Jacobs Engineering Group Inc.
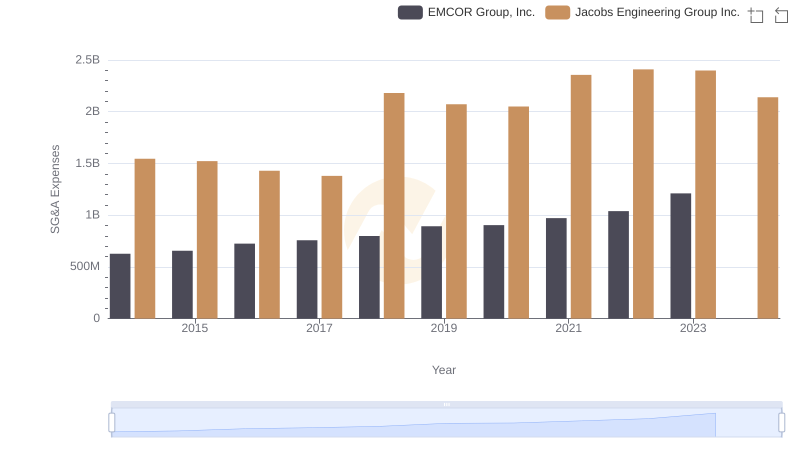
Selling, General, and Administrative Costs: EMCOR Group, Inc. vs Jacobs Engineering Group Inc.
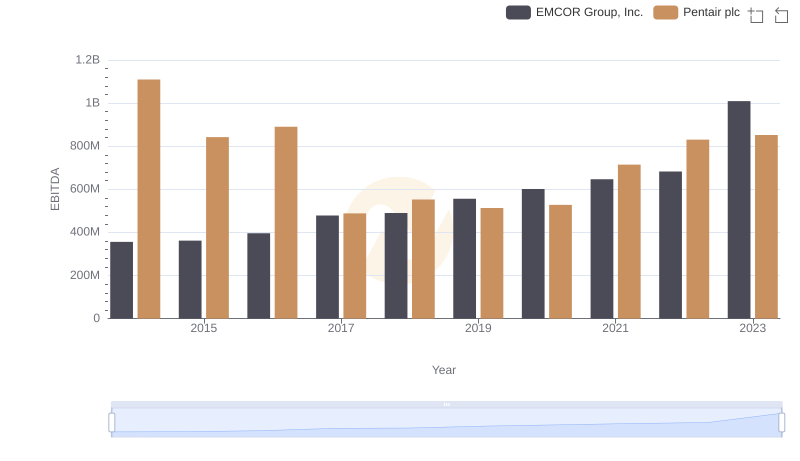
EBITDA Analysis: Evaluating EMCOR Group, Inc. Against Pentair plc
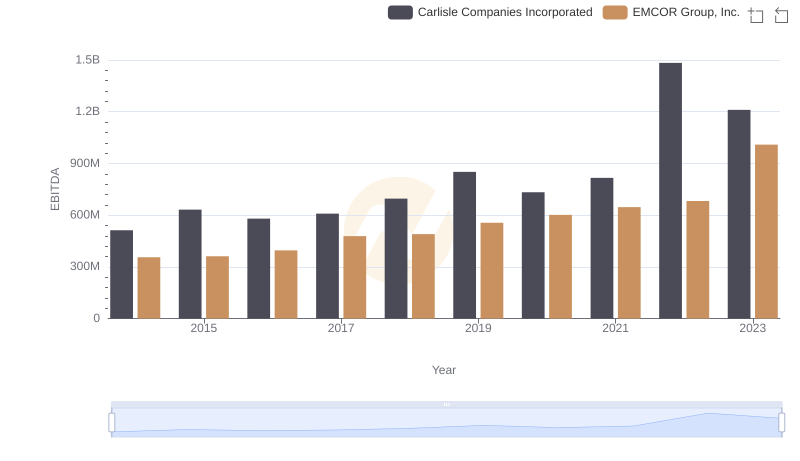
EMCOR Group, Inc. and Carlisle Companies Incorporated: A Detailed Examination of EBITDA Performance
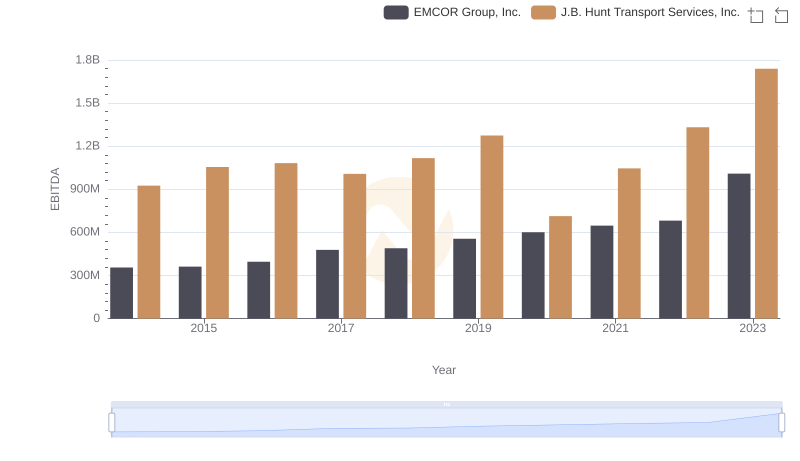
Comparative EBITDA Analysis: EMCOR Group, Inc. vs J.B. Hunt Transport Services, Inc.
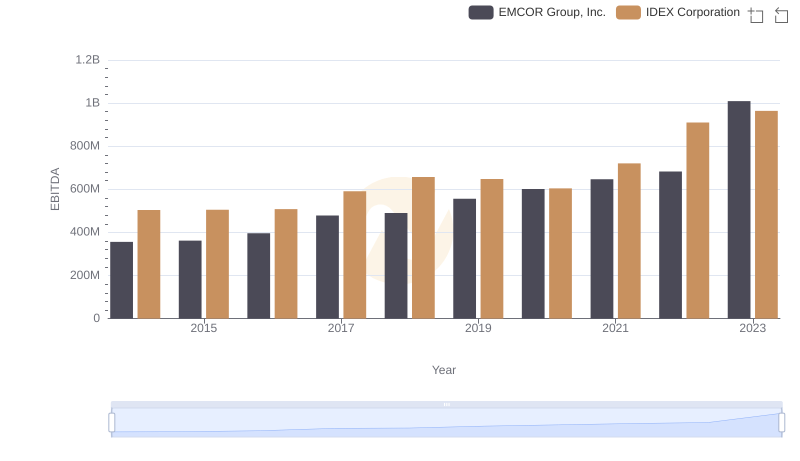
EBITDA Performance Review: EMCOR Group, Inc. vs IDEX Corporation
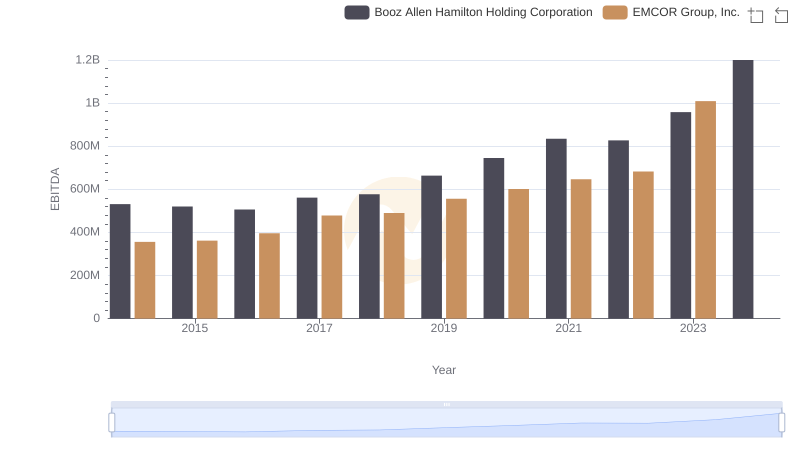
A Professional Review of EBITDA: EMCOR Group, Inc. Compared to Booz Allen Hamilton Holding Corporation
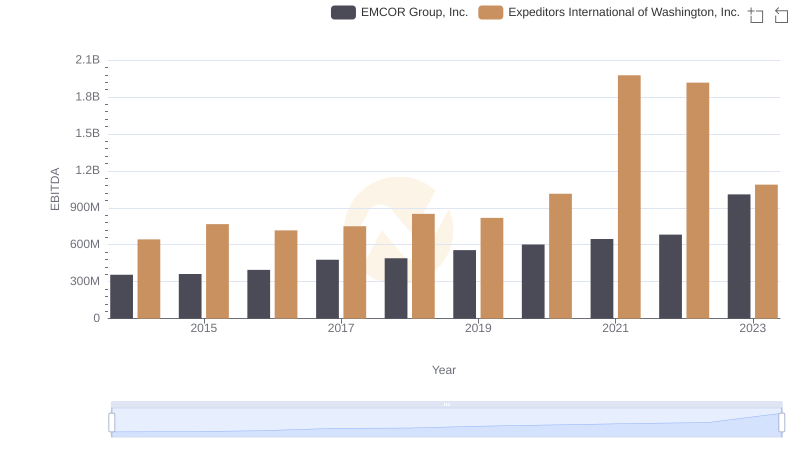
EBITDA Analysis: Evaluating EMCOR Group, Inc. Against Expeditors International of Washington, Inc.