| __timestamp | EMCOR Group, Inc. | IDEX Corporation |
|---|---|---|
| Wednesday, January 1, 2014 | 355858000 | 504019000 |
| Thursday, January 1, 2015 | 362095000 | 505071000 |
| Friday, January 1, 2016 | 395913000 | 507871000 |
| Sunday, January 1, 2017 | 478459000 | 591033000 |
| Monday, January 1, 2018 | 489954000 | 657092000 |
| Tuesday, January 1, 2019 | 556055000 | 647793000 |
| Wednesday, January 1, 2020 | 601449000 | 604602000 |
| Friday, January 1, 2021 | 646861000 | 720500000 |
| Saturday, January 1, 2022 | 682399000 | 909800000 |
| Sunday, January 1, 2023 | 1009017000 | 964100000 |
| Monday, January 1, 2024 | 677200000 |
Unlocking the unknown
In the competitive landscape of industrial services and equipment, EMCOR Group, Inc. and IDEX Corporation have showcased remarkable EBITDA growth over the past decade. From 2014 to 2023, EMCOR's EBITDA surged by approximately 183%, peaking at over $1 billion in 2023. Meanwhile, IDEX Corporation demonstrated a robust 91% increase, reaching nearly $964 million in the same year.
EMCOR's strategic expansions and operational efficiencies have propelled its EBITDA from $356 million in 2014 to over $1 billion in 2023, marking a significant milestone. IDEX, with its innovative product lines, has also seen substantial growth, with EBITDA climbing from $504 million in 2014 to $964 million in 2023.
These trends highlight the resilience and adaptability of both companies in navigating economic challenges and capitalizing on market opportunities. Investors and industry analysts should keep a keen eye on these leaders as they continue to shape the future of their respective sectors.
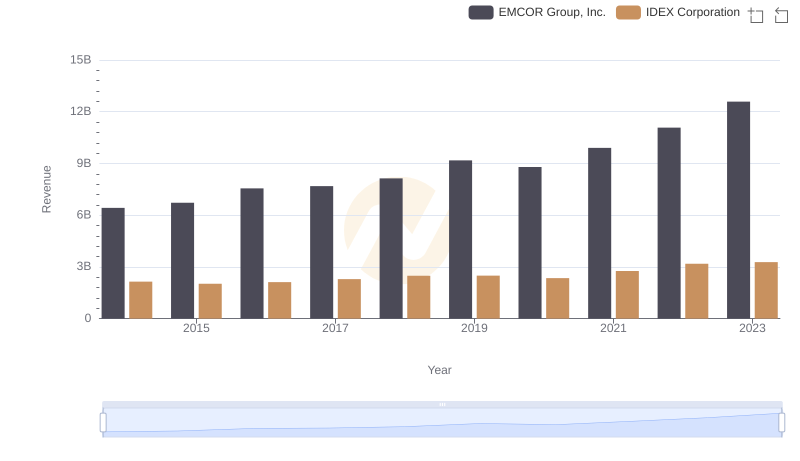
Comparing Revenue Performance: EMCOR Group, Inc. or IDEX Corporation?
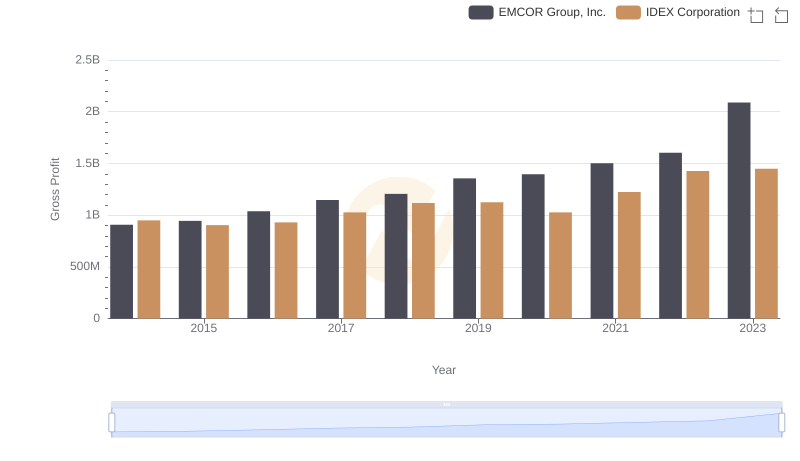
EMCOR Group, Inc. vs IDEX Corporation: A Gross Profit Performance Breakdown
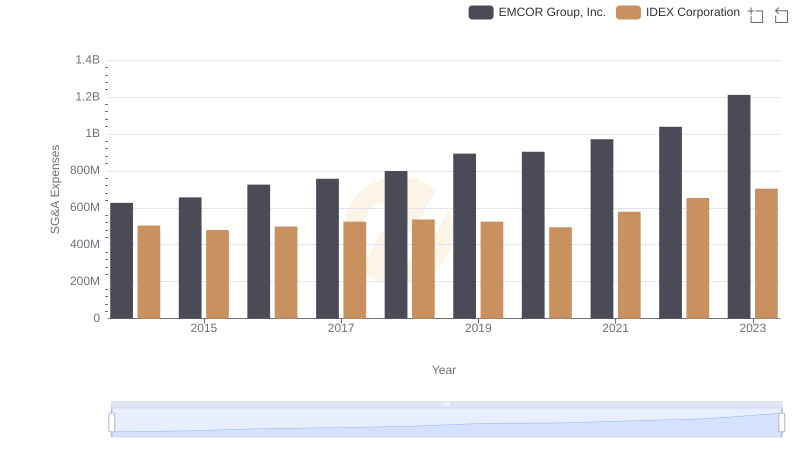
Breaking Down SG&A Expenses: EMCOR Group, Inc. vs IDEX Corporation
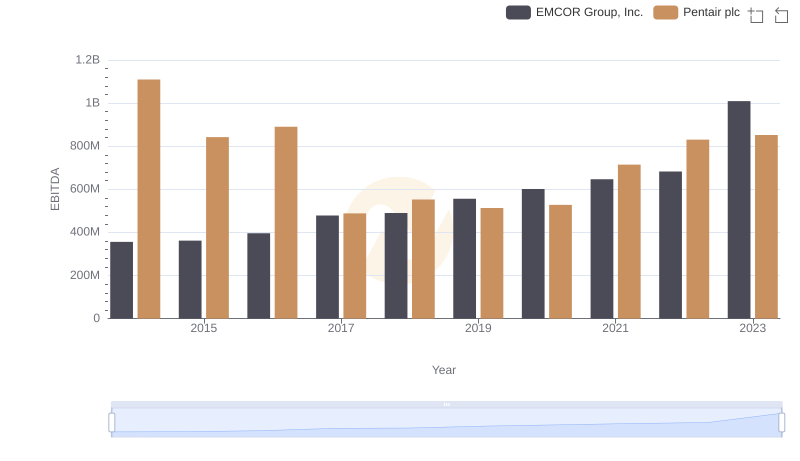
EBITDA Analysis: Evaluating EMCOR Group, Inc. Against Pentair plc
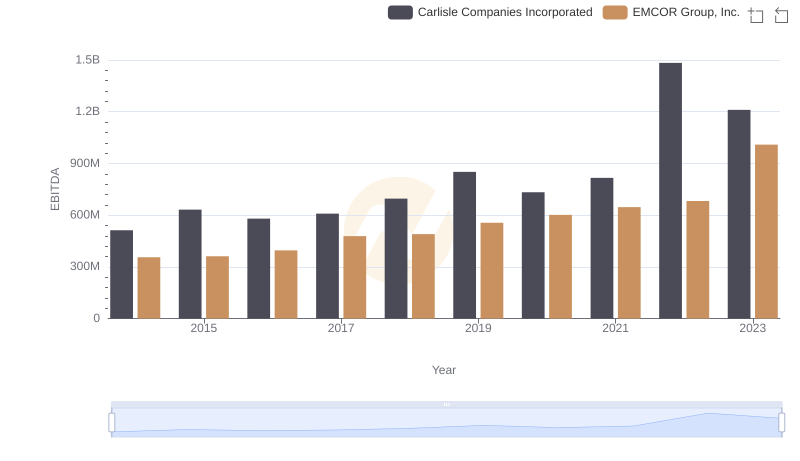
EMCOR Group, Inc. and Carlisle Companies Incorporated: A Detailed Examination of EBITDA Performance
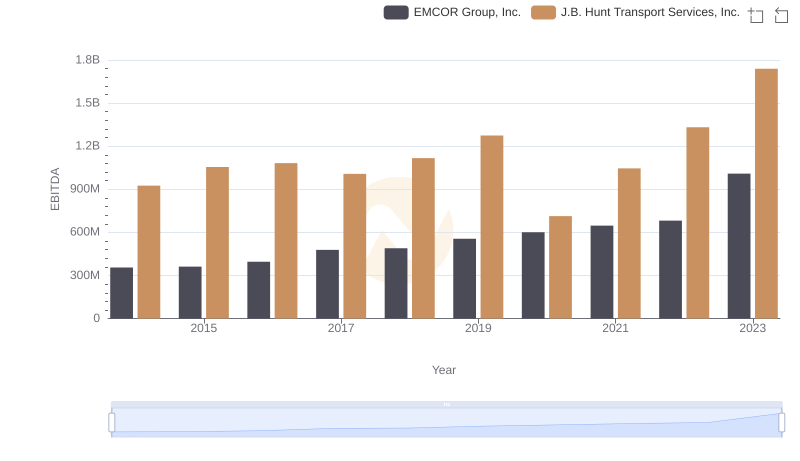
Comparative EBITDA Analysis: EMCOR Group, Inc. vs J.B. Hunt Transport Services, Inc.
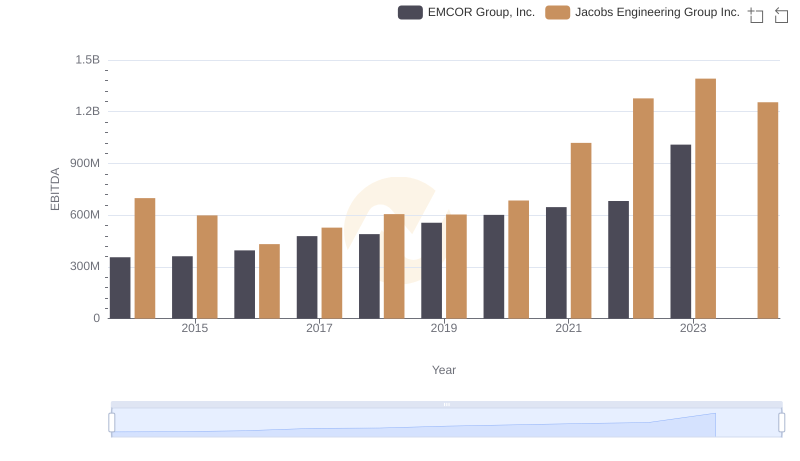
Comparative EBITDA Analysis: EMCOR Group, Inc. vs Jacobs Engineering Group Inc.
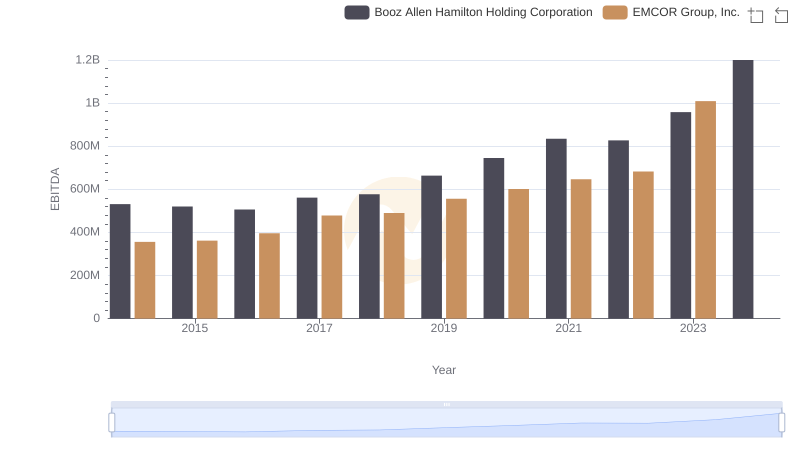
A Professional Review of EBITDA: EMCOR Group, Inc. Compared to Booz Allen Hamilton Holding Corporation
EBITDA Analysis: Evaluating EMCOR Group, Inc. Against Expeditors International of Washington, Inc.