| __timestamp | EMCOR Group, Inc. | Pentair plc |
|---|---|---|
| Wednesday, January 1, 2014 | 355858000 | 1109300000 |
| Thursday, January 1, 2015 | 362095000 | 842400000 |
| Friday, January 1, 2016 | 395913000 | 890400000 |
| Sunday, January 1, 2017 | 478459000 | 488600000 |
| Monday, January 1, 2018 | 489954000 | 552800000 |
| Tuesday, January 1, 2019 | 556055000 | 513200000 |
| Wednesday, January 1, 2020 | 601449000 | 527600000 |
| Friday, January 1, 2021 | 646861000 | 714400000 |
| Saturday, January 1, 2022 | 682399000 | 830400000 |
| Sunday, January 1, 2023 | 1009017000 | 852000000 |
| Monday, January 1, 2024 | 803800000 |
Unveiling the hidden dimensions of data
In the ever-evolving landscape of industrial services and water solutions, EMCOR Group, Inc. and Pentair plc have been pivotal players. Over the past decade, EMCOR has demonstrated a robust growth trajectory in EBITDA, with a remarkable 183% increase from 2014 to 2023. This growth is highlighted by a significant leap in 2023, where EMCOR's EBITDA surged to over $1 billion, marking a 48% increase from the previous year.
Conversely, Pentair plc, while maintaining a steady performance, experienced a more modest 22% growth in EBITDA over the same period. Notably, Pentair's EBITDA peaked in 2014, and despite fluctuations, it has shown resilience, closing 2023 with an EBITDA of approximately $852 million.
This analysis underscores EMCOR's strategic advancements and Pentair's steady resilience, offering valuable insights for investors and industry analysts alike.
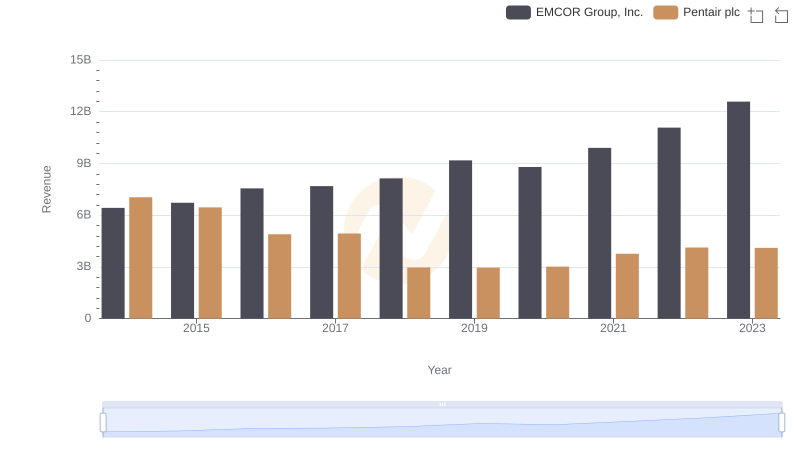
Revenue Insights: EMCOR Group, Inc. and Pentair plc Performance Compared
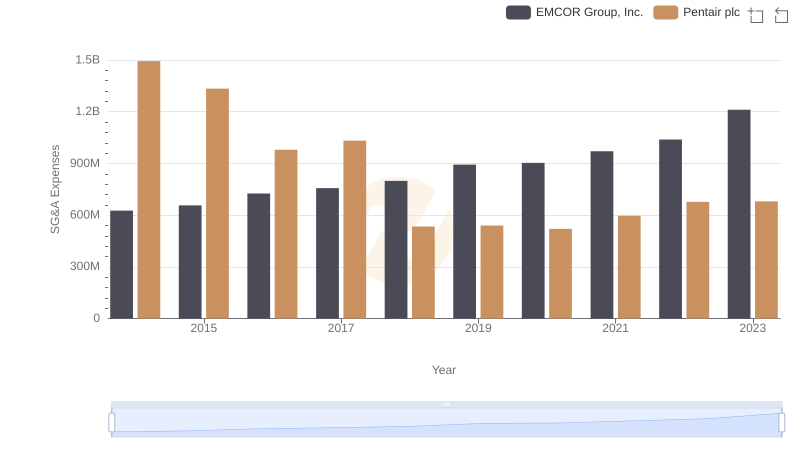
EMCOR Group, Inc. and Pentair plc: SG&A Spending Patterns Compared
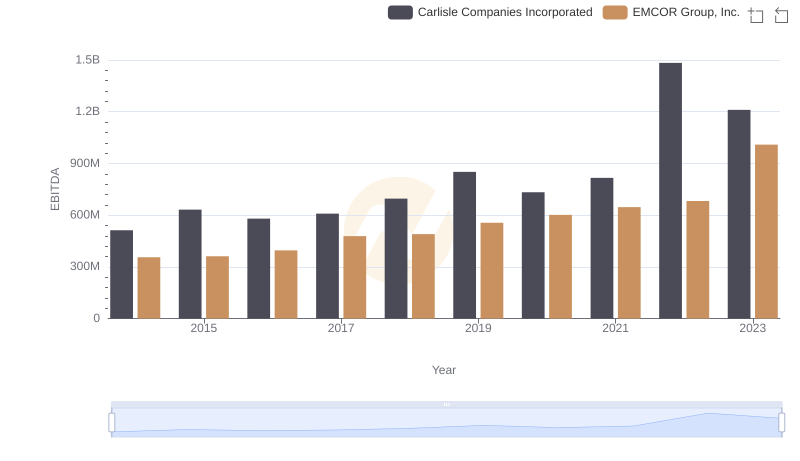
EMCOR Group, Inc. and Carlisle Companies Incorporated: A Detailed Examination of EBITDA Performance
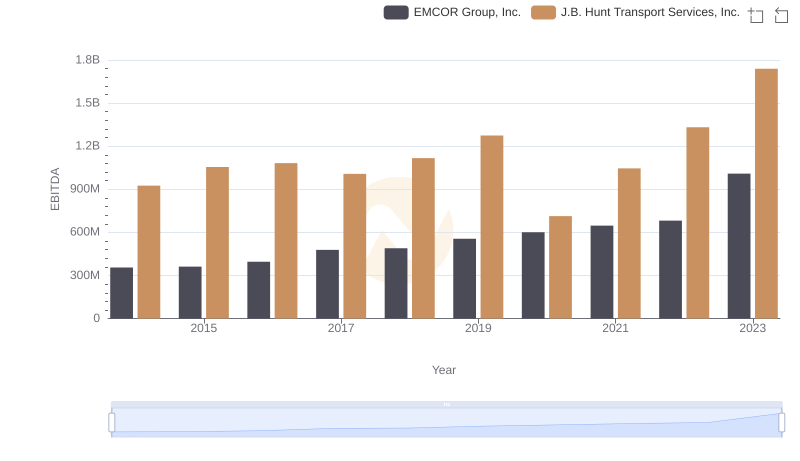
Comparative EBITDA Analysis: EMCOR Group, Inc. vs J.B. Hunt Transport Services, Inc.
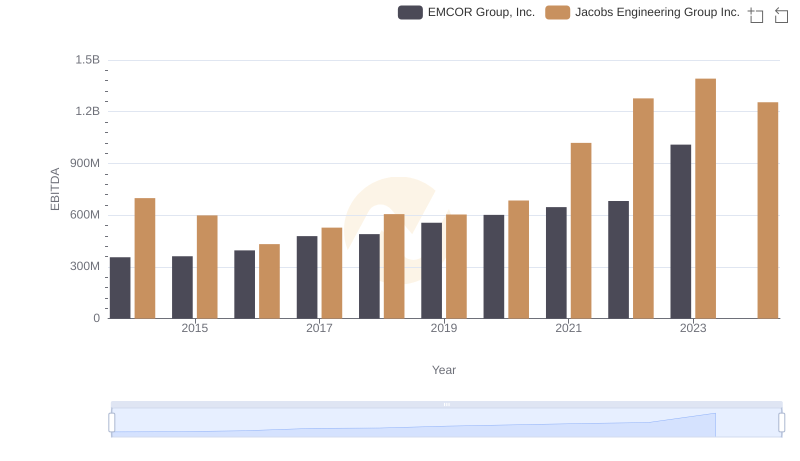
Comparative EBITDA Analysis: EMCOR Group, Inc. vs Jacobs Engineering Group Inc.
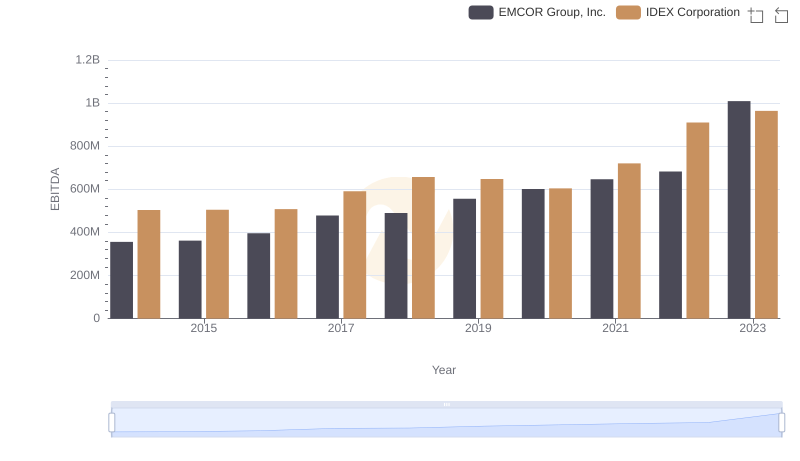
EBITDA Performance Review: EMCOR Group, Inc. vs IDEX Corporation
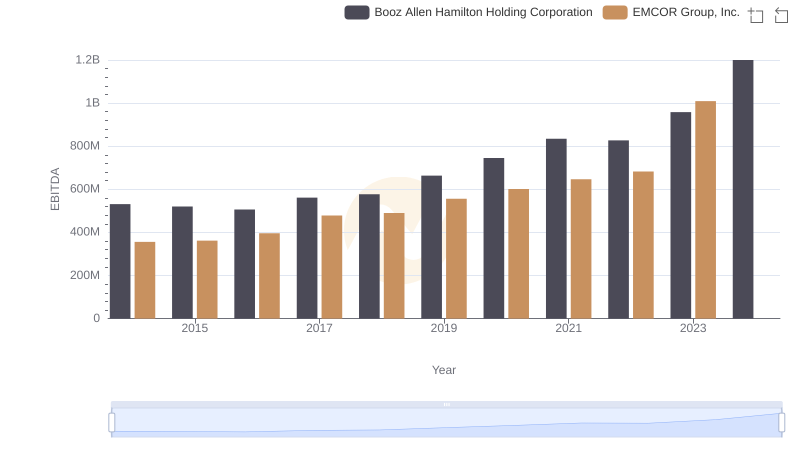
A Professional Review of EBITDA: EMCOR Group, Inc. Compared to Booz Allen Hamilton Holding Corporation
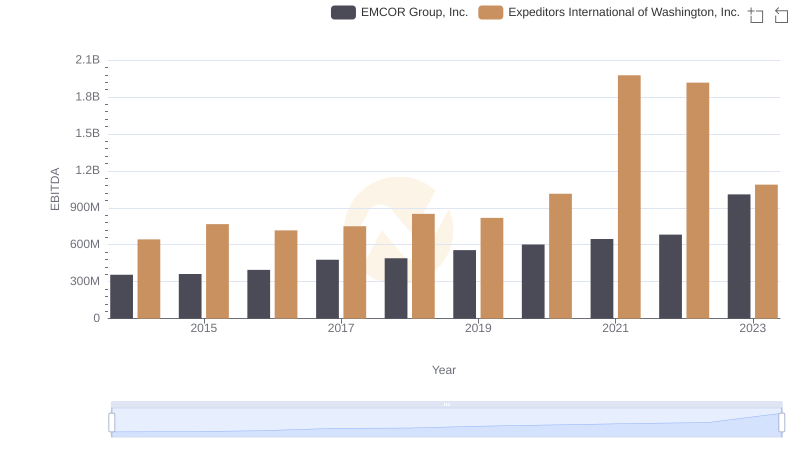
EBITDA Analysis: Evaluating EMCOR Group, Inc. Against Expeditors International of Washington, Inc.