| __timestamp | EMCOR Group, Inc. | Expeditors International of Washington, Inc. |
|---|---|---|
| Wednesday, January 1, 2014 | 5517719000 | 5800725000 |
| Thursday, January 1, 2015 | 5774247000 | 5720848000 |
| Friday, January 1, 2016 | 6513662000 | 5247244000 |
| Sunday, January 1, 2017 | 6539987000 | 6037921000 |
| Monday, January 1, 2018 | 6925178000 | 7118083000 |
| Tuesday, January 1, 2019 | 7818743000 | 7178405000 |
| Wednesday, January 1, 2020 | 7401679000 | 8953716000 |
| Friday, January 1, 2021 | 8401843000 | 14358105000 |
| Saturday, January 1, 2022 | 9472526000 | 14900154000 |
| Sunday, January 1, 2023 | 10493534000 | 8054634000 |
| Monday, January 1, 2024 | 0 |
In pursuit of knowledge
In the ever-evolving landscape of the U.S. stock market, understanding the cost of revenue is crucial for investors and analysts alike. From 2014 to 2023, EMCOR Group, Inc. and Expeditors International of Washington, Inc. have shown distinct trajectories in their cost of revenue. EMCOR Group's cost of revenue surged by approximately 90%, peaking in 2023, while Expeditors International experienced a 38% increase, reaching its zenith in 2022. Notably, 2021 marked a significant year for Expeditors, with a 60% jump from the previous year, reflecting strategic operational shifts. Meanwhile, EMCOR's steady growth underscores its robust business model. These insights provide a window into the operational efficiencies and market strategies of these industry giants, offering valuable lessons for stakeholders aiming to navigate the complexities of the financial world.
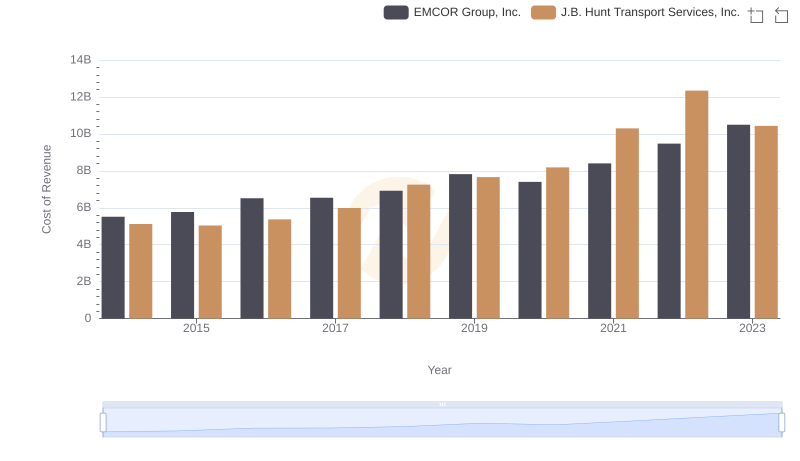
Cost of Revenue: Key Insights for EMCOR Group, Inc. and J.B. Hunt Transport Services, Inc.
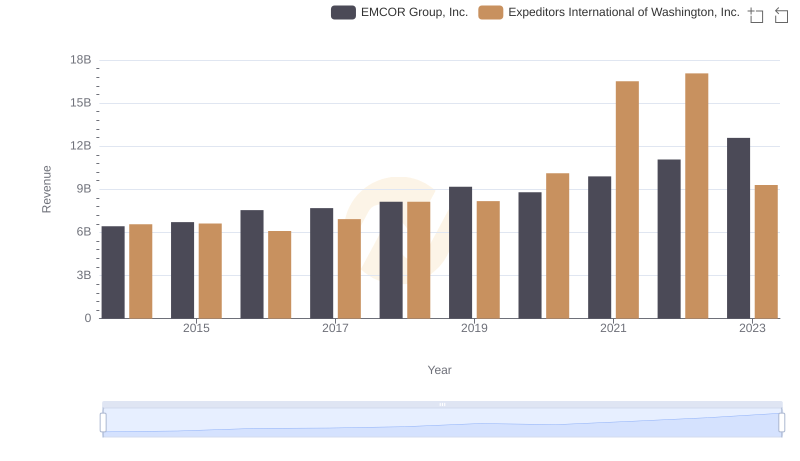
EMCOR Group, Inc. or Expeditors International of Washington, Inc.: Who Leads in Yearly Revenue?
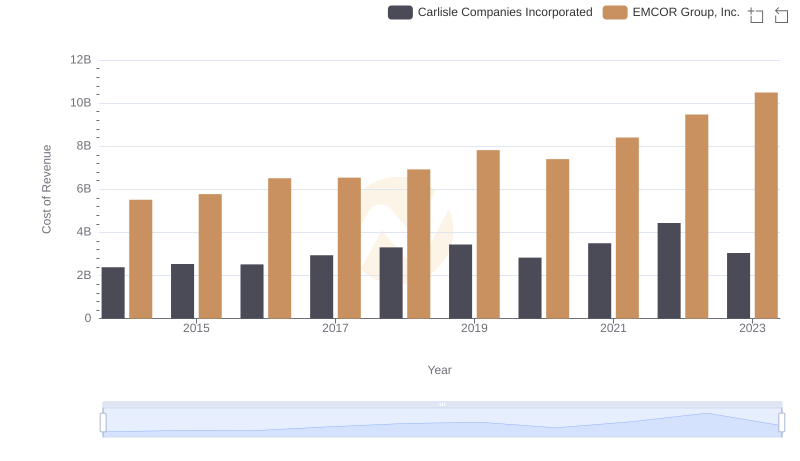
Comparing Cost of Revenue Efficiency: EMCOR Group, Inc. vs Carlisle Companies Incorporated
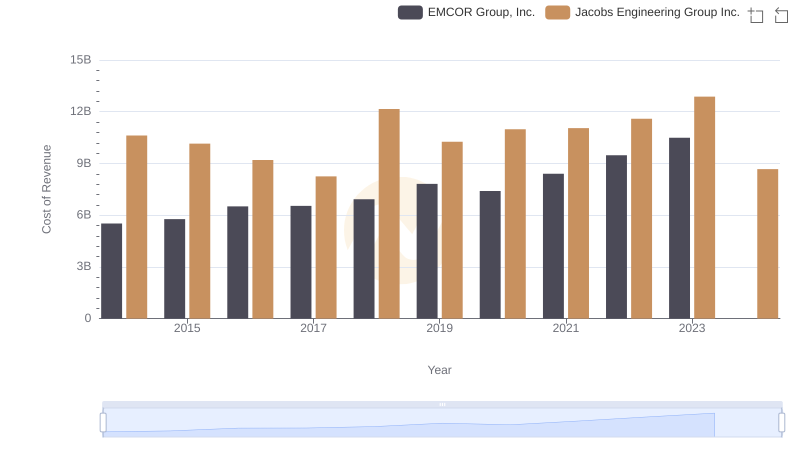
EMCOR Group, Inc. vs Jacobs Engineering Group Inc.: Efficiency in Cost of Revenue Explored
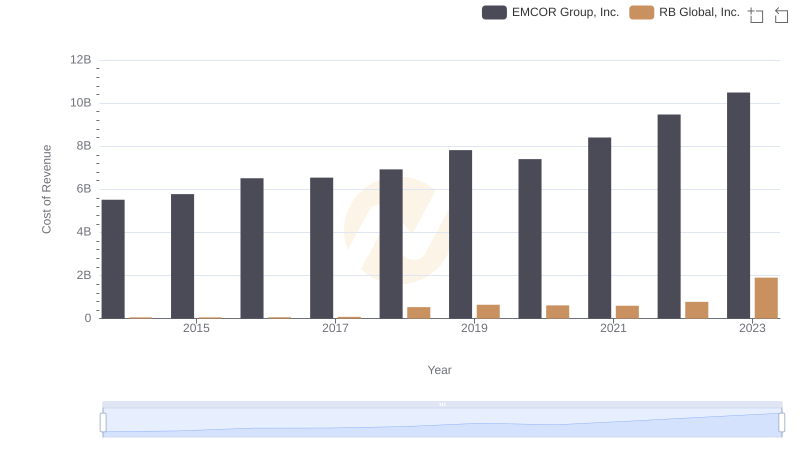
EMCOR Group, Inc. vs RB Global, Inc.: Efficiency in Cost of Revenue Explored
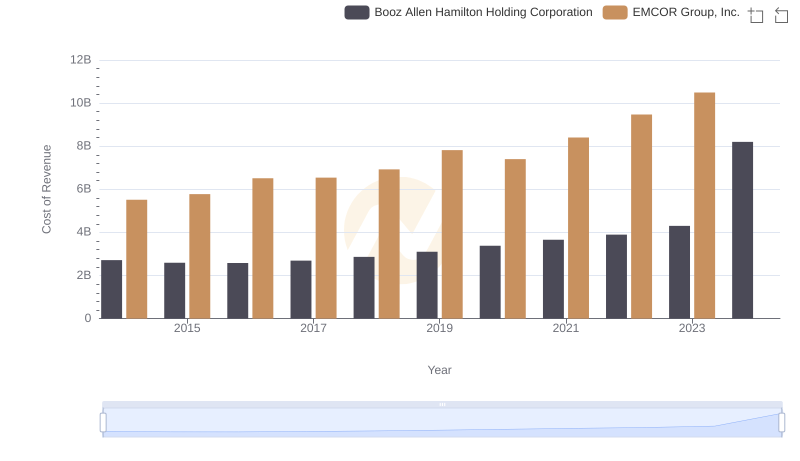
Cost of Revenue Trends: EMCOR Group, Inc. vs Booz Allen Hamilton Holding Corporation
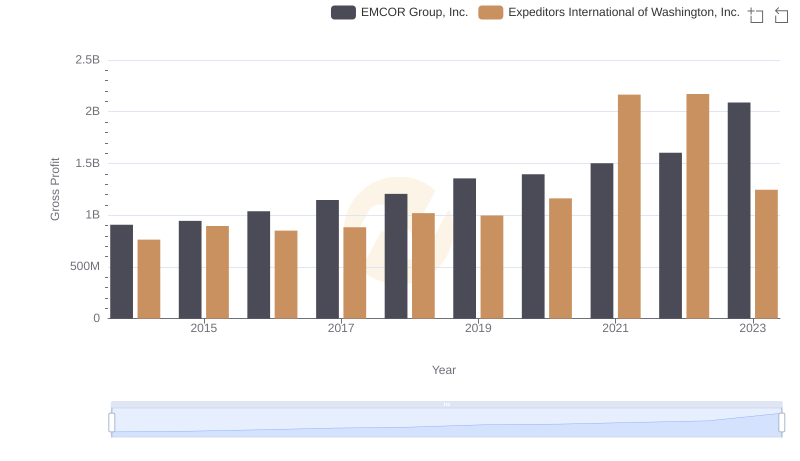
Gross Profit Analysis: Comparing EMCOR Group, Inc. and Expeditors International of Washington, Inc.
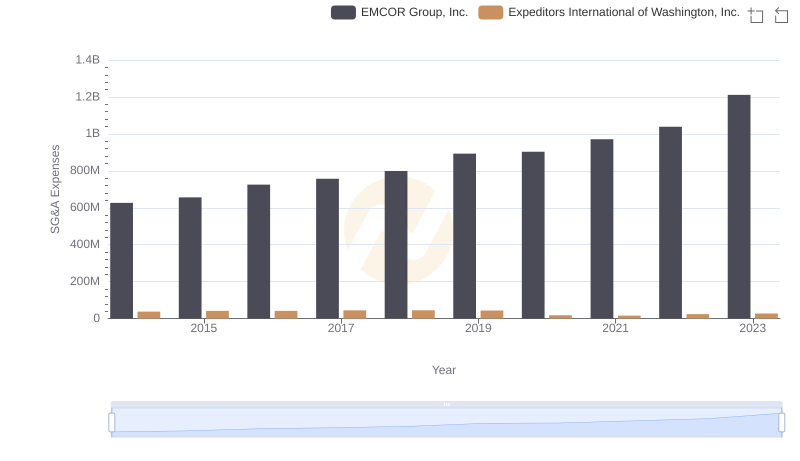
EMCOR Group, Inc. and Expeditors International of Washington, Inc.: SG&A Spending Patterns Compared
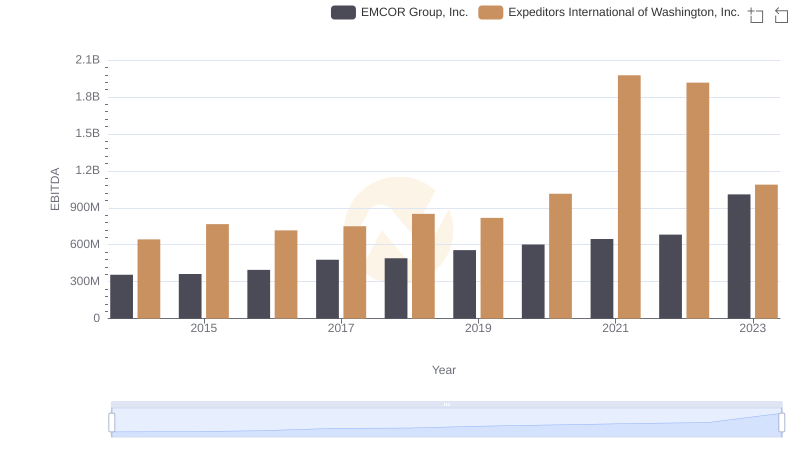
EBITDA Analysis: Evaluating EMCOR Group, Inc. Against Expeditors International of Washington, Inc.