| __timestamp | EMCOR Group, Inc. | J.B. Hunt Transport Services, Inc. |
|---|---|---|
| Wednesday, January 1, 2014 | 355858000 | 926038000 |
| Thursday, January 1, 2015 | 362095000 | 1055307000 |
| Friday, January 1, 2016 | 395913000 | 1082601000 |
| Sunday, January 1, 2017 | 478459000 | 1007307000 |
| Monday, January 1, 2018 | 489954000 | 1116914000 |
| Tuesday, January 1, 2019 | 556055000 | 1274241000 |
| Wednesday, January 1, 2020 | 601449000 | 713119000 |
| Friday, January 1, 2021 | 646861000 | 1045530000 |
| Saturday, January 1, 2022 | 682399000 | 1331553000 |
| Sunday, January 1, 2023 | 1009017000 | 1738774000 |
Cracking the code
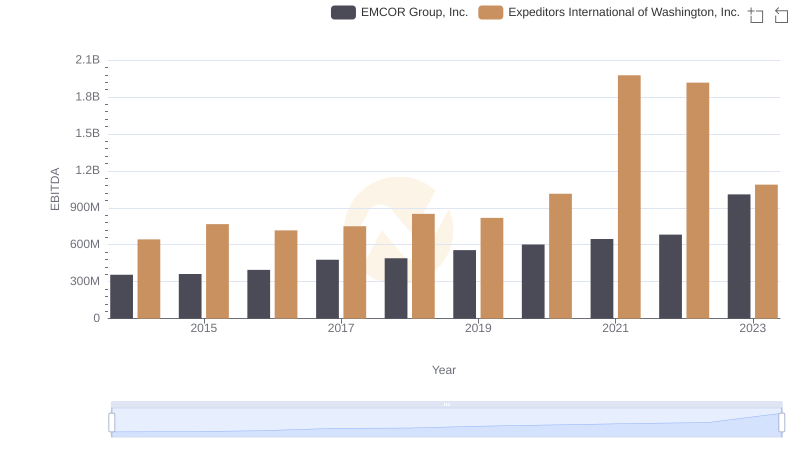
In the competitive landscape of American industry, EMCOR Group, Inc. and J.B. Hunt Transport Services, Inc. have demonstrated remarkable EBITDA growth over the past decade. From 2014 to 2023, EMCOR's EBITDA surged by approximately 184%, while J.B. Hunt's increased by around 88%. This growth reflects strategic expansions and operational efficiencies.
EMCOR, a leader in mechanical and electrical construction services, saw its EBITDA rise from $356 million in 2014 to over $1 billion in 2023. This growth underscores EMCOR's ability to capitalize on infrastructure demands and technological advancements.
J.B. Hunt, a titan in transportation and logistics, experienced a steady EBITDA increase, reaching nearly $1.74 billion in 2023. Despite a dip in 2020, the company rebounded, showcasing resilience in a volatile market.
These insights highlight the dynamic nature of these industries and the strategic maneuvers that drive financial success.
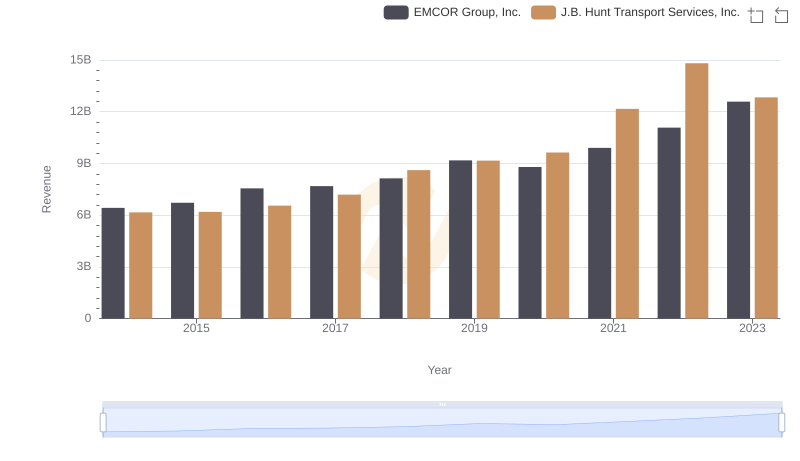
Annual Revenue Comparison: EMCOR Group, Inc. vs J.B. Hunt Transport Services, Inc.
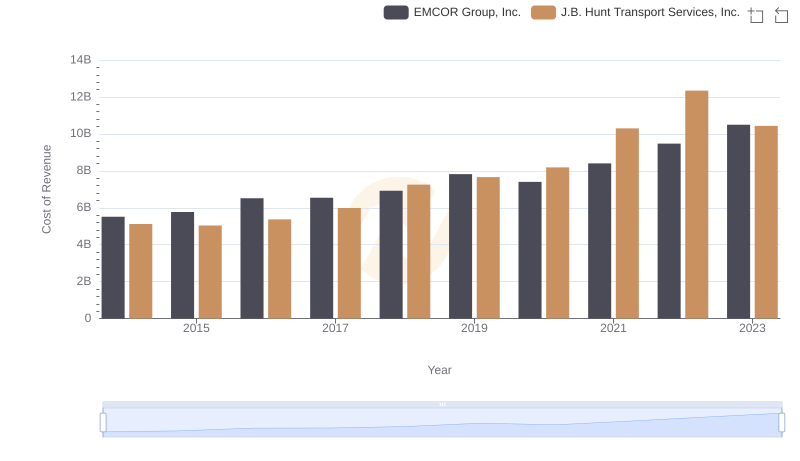
Cost of Revenue: Key Insights for EMCOR Group, Inc. and J.B. Hunt Transport Services, Inc.
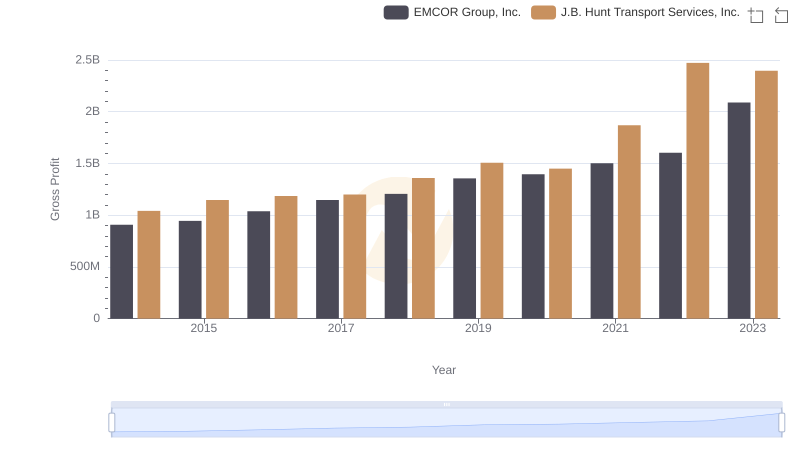
Gross Profit Trends Compared: EMCOR Group, Inc. vs J.B. Hunt Transport Services, Inc.

Breaking Down SG&A Expenses: EMCOR Group, Inc. vs J.B. Hunt Transport Services, Inc.
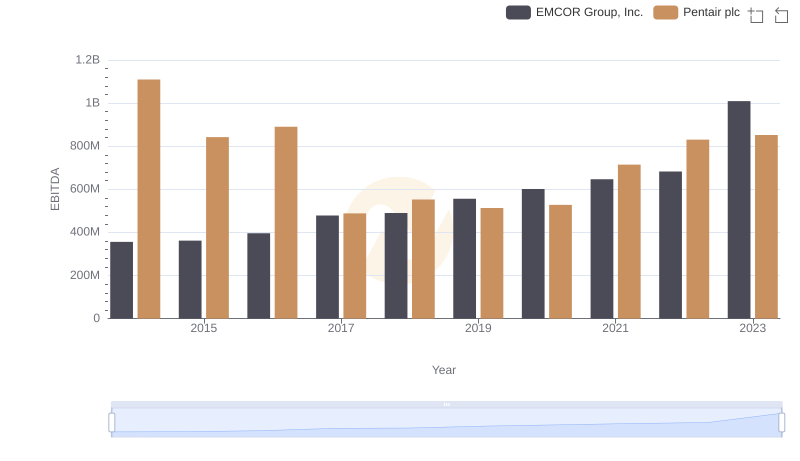
EBITDA Analysis: Evaluating EMCOR Group, Inc. Against Pentair plc
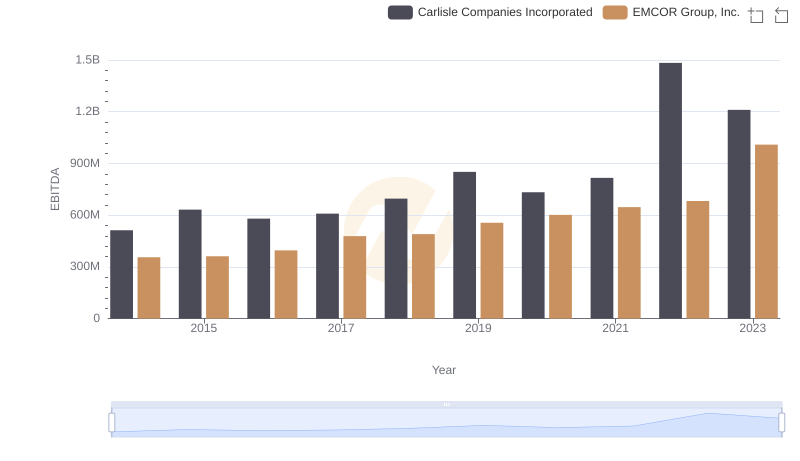
EMCOR Group, Inc. and Carlisle Companies Incorporated: A Detailed Examination of EBITDA Performance
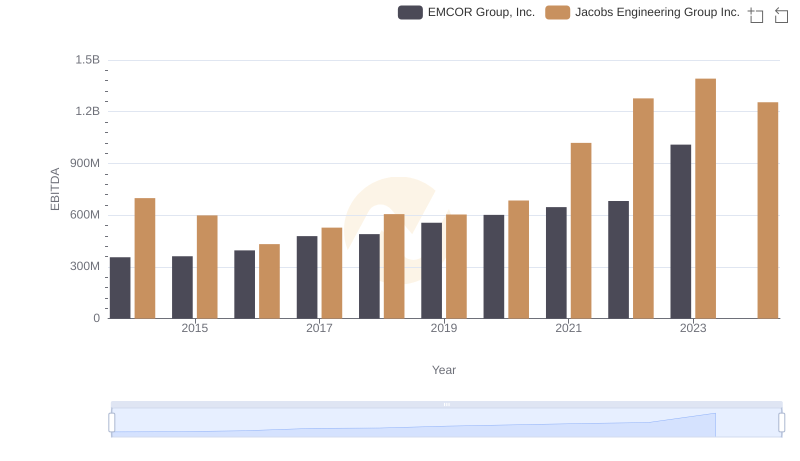
Comparative EBITDA Analysis: EMCOR Group, Inc. vs Jacobs Engineering Group Inc.
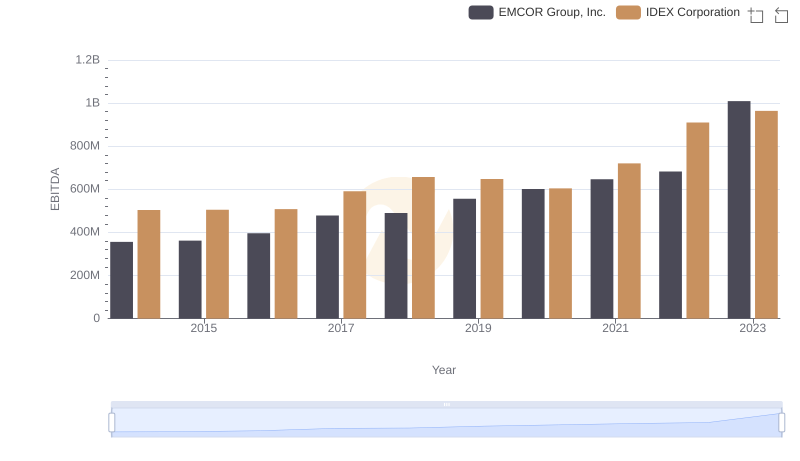
EBITDA Performance Review: EMCOR Group, Inc. vs IDEX Corporation
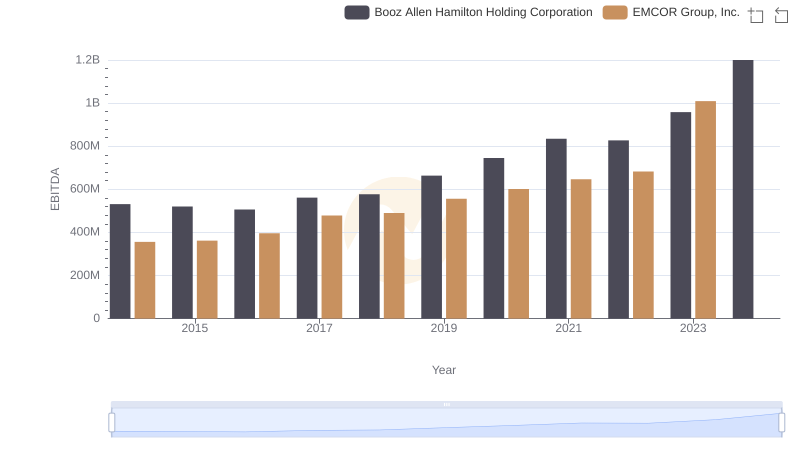
A Professional Review of EBITDA: EMCOR Group, Inc. Compared to Booz Allen Hamilton Holding Corporation
EBITDA Analysis: Evaluating EMCOR Group, Inc. Against Expeditors International of Washington, Inc.