| __timestamp | Cisco Systems, Inc. | Monolithic Power Systems, Inc. |
|---|---|---|
| Wednesday, January 1, 2014 | 12709000000 | 41003000 |
| Thursday, January 1, 2015 | 14209000000 | 53346000 |
| Friday, January 1, 2016 | 15678000000 | 65992000 |
| Sunday, January 1, 2017 | 15383000000 | 94768000 |
| Monday, January 1, 2018 | 16172000000 | 127721000 |
| Tuesday, January 1, 2019 | 17334000000 | 119893000 |
| Wednesday, January 1, 2020 | 16363000000 | 185872000 |
| Friday, January 1, 2021 | 15558000000 | 291116000 |
| Saturday, January 1, 2022 | 16794000000 | 563899000 |
| Sunday, January 1, 2023 | 17471000000 | 521904000 |
| Monday, January 1, 2024 | 15747000000 |
Infusing magic into the data realm
In the ever-evolving tech landscape, Cisco Systems, Inc. and Monolithic Power Systems, Inc. have carved distinct paths. From 2014 to 2023, Cisco's EBITDA has shown a steady upward trend, peaking in 2023 with a 37% increase from 2014. This growth underscores Cisco's robust market position and strategic adaptability. In contrast, Monolithic Power Systems, Inc. has experienced a remarkable surge, with its EBITDA skyrocketing by over 1,200% during the same period. This exponential growth highlights its innovative prowess and expanding market footprint. Notably, 2022 marked a significant year for Monolithic, with EBITDA reaching its zenith, reflecting its strategic advancements. However, 2024 data for Monolithic is missing, leaving room for speculation on its future trajectory. This comparison not only showcases the dynamic nature of the tech industry but also emphasizes the diverse strategies employed by these two giants.

Who Generates More Revenue? Cisco Systems, Inc. or Monolithic Power Systems, Inc.
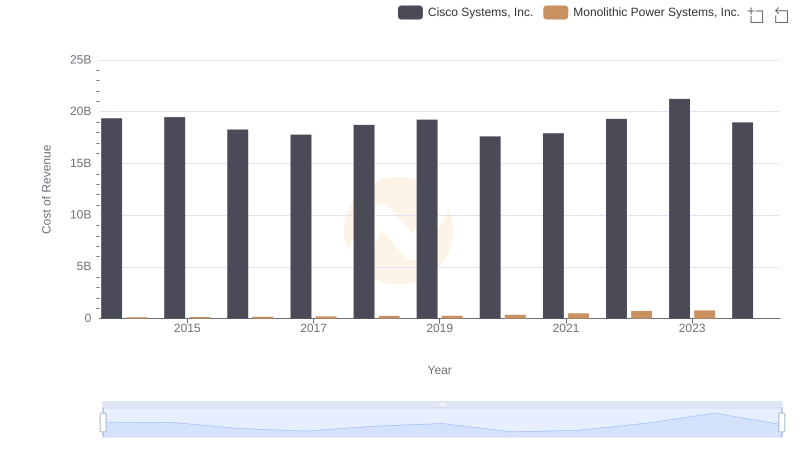
Comparing Cost of Revenue Efficiency: Cisco Systems, Inc. vs Monolithic Power Systems, Inc.
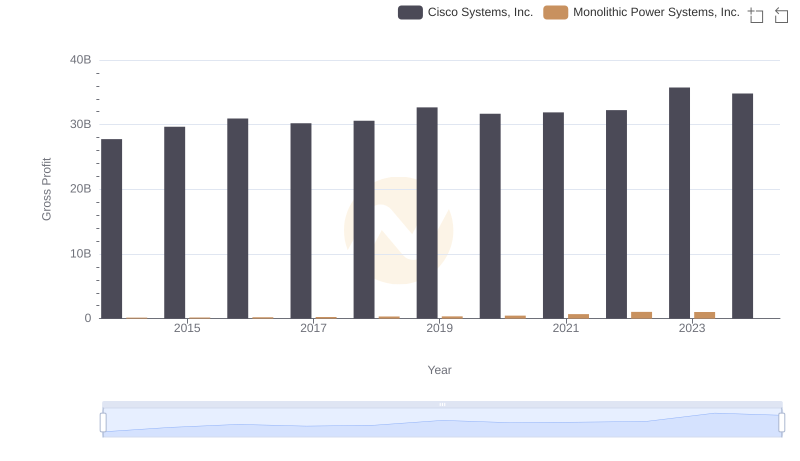
Key Insights on Gross Profit: Cisco Systems, Inc. vs Monolithic Power Systems, Inc.
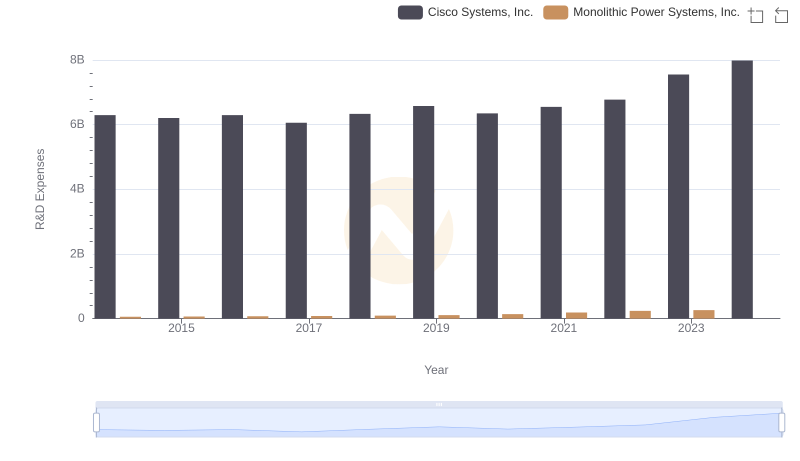
Cisco Systems, Inc. vs Monolithic Power Systems, Inc.: Strategic Focus on R&D Spending
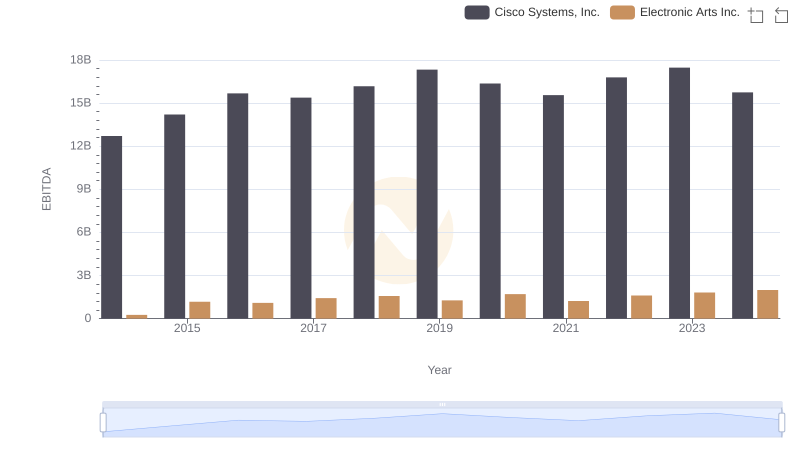
Professional EBITDA Benchmarking: Cisco Systems, Inc. vs Electronic Arts Inc.
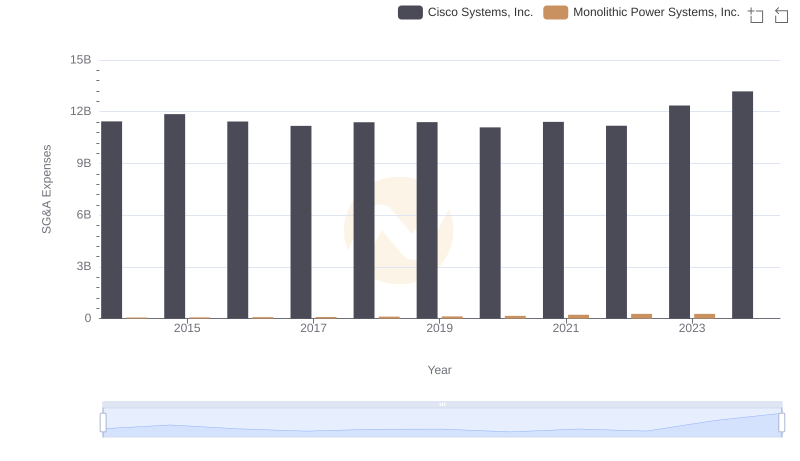
Breaking Down SG&A Expenses: Cisco Systems, Inc. vs Monolithic Power Systems, Inc.
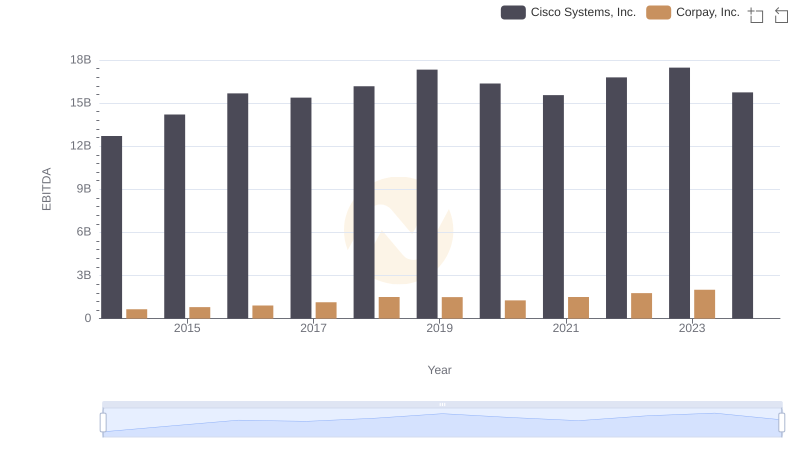
EBITDA Metrics Evaluated: Cisco Systems, Inc. vs Corpay, Inc.
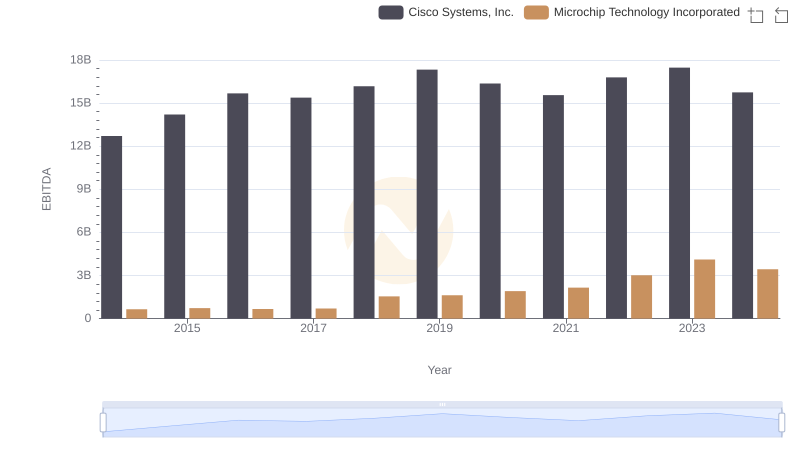
A Side-by-Side Analysis of EBITDA: Cisco Systems, Inc. and Microchip Technology Incorporated
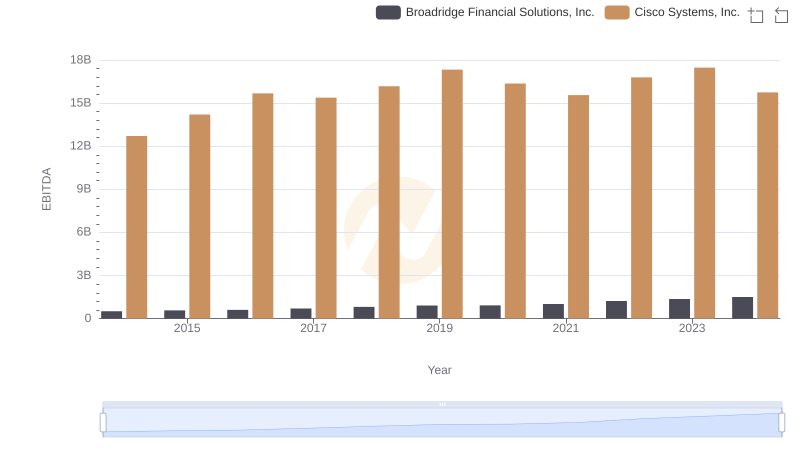
EBITDA Metrics Evaluated: Cisco Systems, Inc. vs Broadridge Financial Solutions, Inc.
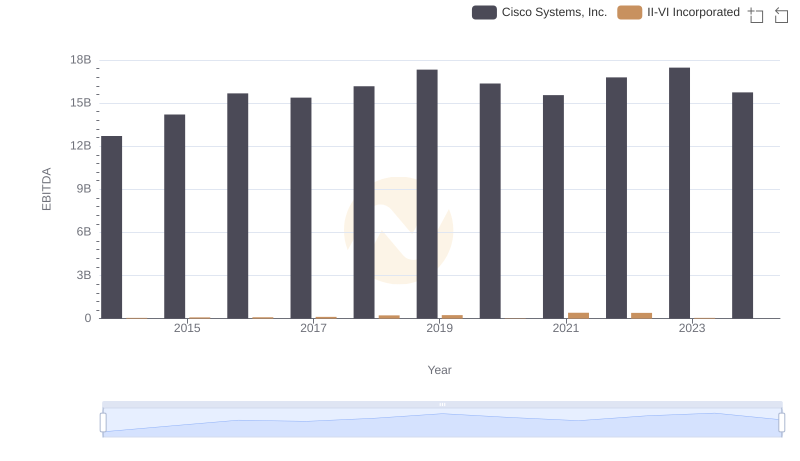
EBITDA Performance Review: Cisco Systems, Inc. vs II-VI Incorporated
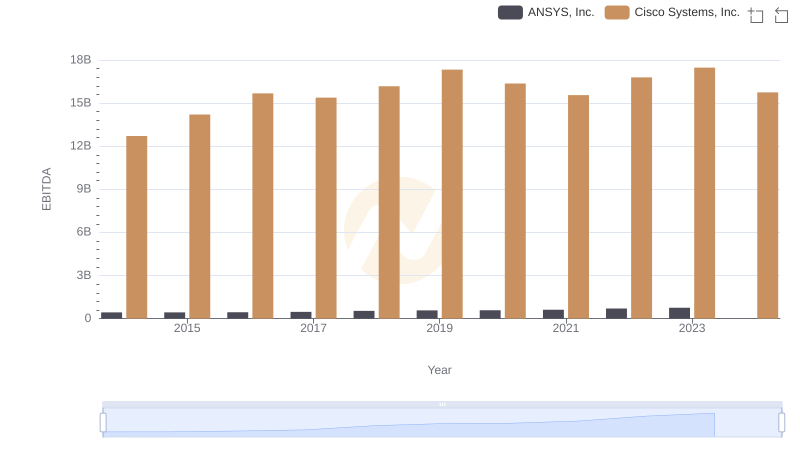
A Side-by-Side Analysis of EBITDA: Cisco Systems, Inc. and ANSYS, Inc.
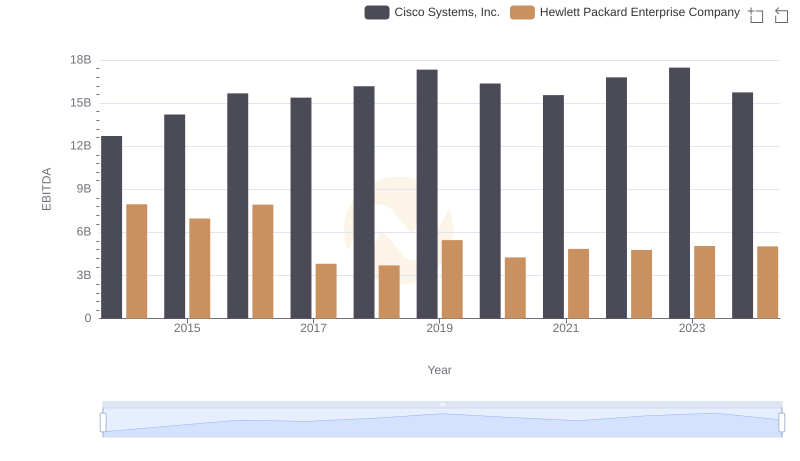
Comparative EBITDA Analysis: Cisco Systems, Inc. vs Hewlett Packard Enterprise Company