| __timestamp | Broadridge Financial Solutions, Inc. | Cisco Systems, Inc. |
|---|---|---|
| Wednesday, January 1, 2014 | 515600000 | 12709000000 |
| Thursday, January 1, 2015 | 571200000 | 14209000000 |
| Friday, January 1, 2016 | 608400000 | 15678000000 |
| Sunday, January 1, 2017 | 706000000 | 15383000000 |
| Monday, January 1, 2018 | 815500000 | 16172000000 |
| Tuesday, January 1, 2019 | 912800000 | 17334000000 |
| Wednesday, January 1, 2020 | 924200000 | 16363000000 |
| Friday, January 1, 2021 | 1013300000 | 15558000000 |
| Saturday, January 1, 2022 | 1223900000 | 16794000000 |
| Sunday, January 1, 2023 | 1361400000 | 17471000000 |
| Monday, January 1, 2024 | 1505500000 | 15747000000 |
Cracking the code
In the ever-evolving landscape of technology and financial solutions, Cisco Systems, Inc. and Broadridge Financial Solutions, Inc. stand as titans in their respective fields. Over the past decade, Cisco has consistently demonstrated its prowess, with EBITDA figures soaring by approximately 37% from 2014 to 2023. This growth underscores Cisco's robust market position and its ability to adapt to technological advancements.
Conversely, Broadridge has shown remarkable resilience and growth, with its EBITDA nearly tripling over the same period. This impressive 192% increase highlights Broadridge's strategic expansions and its pivotal role in financial services.
As we look to the future, these trends offer a glimpse into the dynamic interplay between technology and finance, with both companies poised to continue their upward trajectories. The data from 2014 to 2023 paints a vivid picture of growth, innovation, and market leadership.
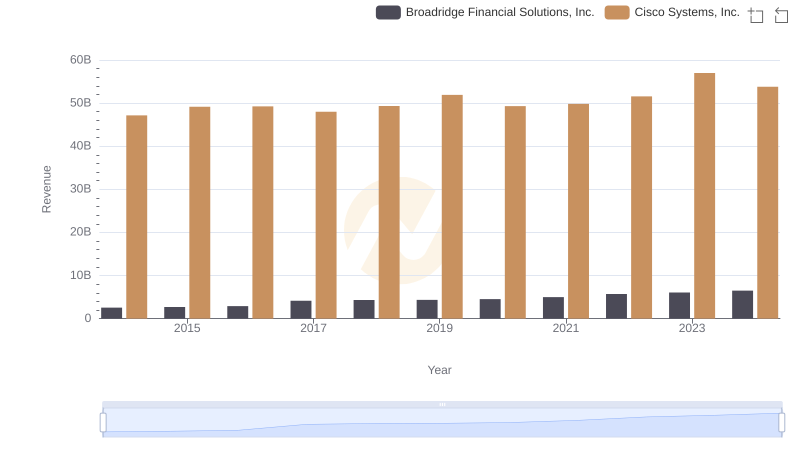
Cisco Systems, Inc. or Broadridge Financial Solutions, Inc.: Who Leads in Yearly Revenue?
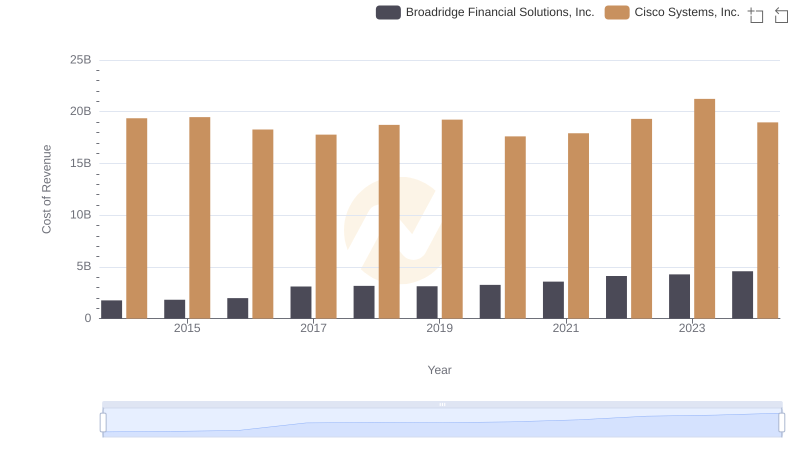
Analyzing Cost of Revenue: Cisco Systems, Inc. and Broadridge Financial Solutions, Inc.
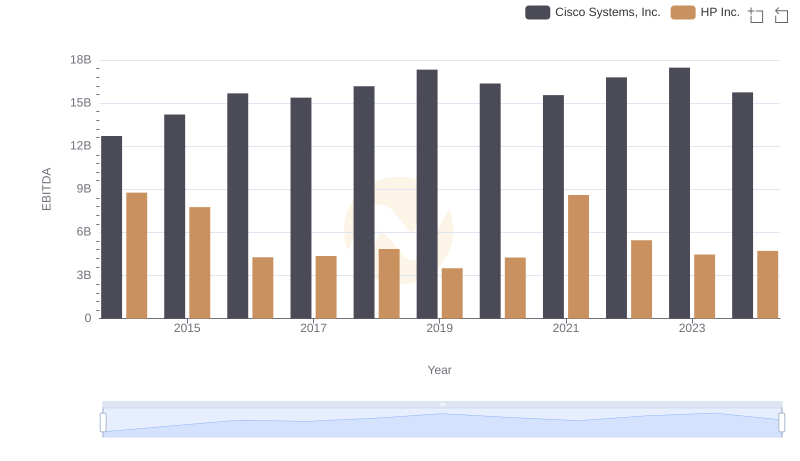
Professional EBITDA Benchmarking: Cisco Systems, Inc. vs HP Inc.
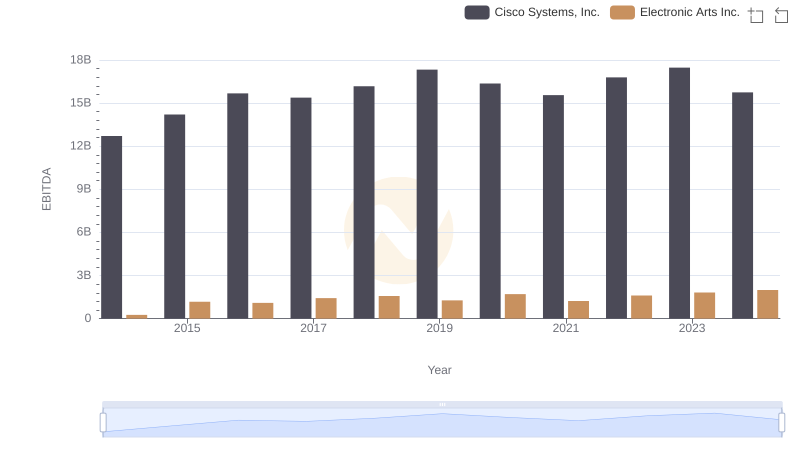
Professional EBITDA Benchmarking: Cisco Systems, Inc. vs Electronic Arts Inc.
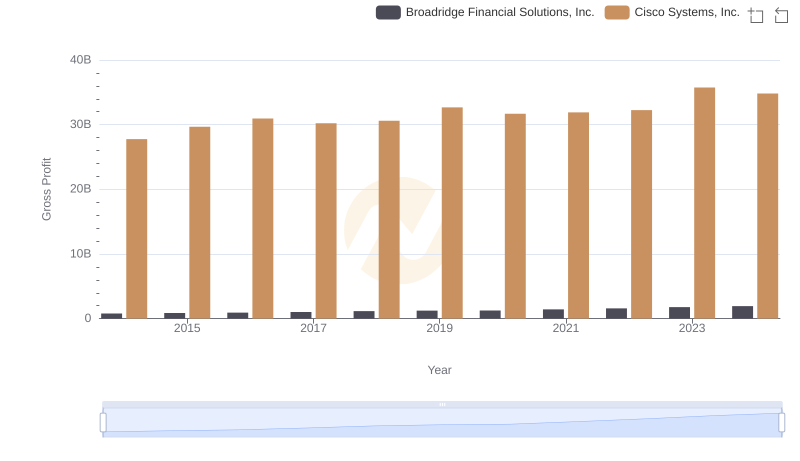
Gross Profit Comparison: Cisco Systems, Inc. and Broadridge Financial Solutions, Inc. Trends
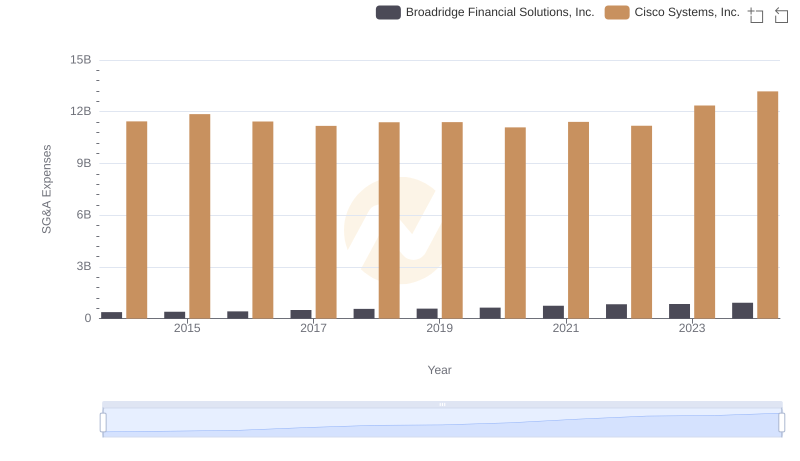
Breaking Down SG&A Expenses: Cisco Systems, Inc. vs Broadridge Financial Solutions, Inc.
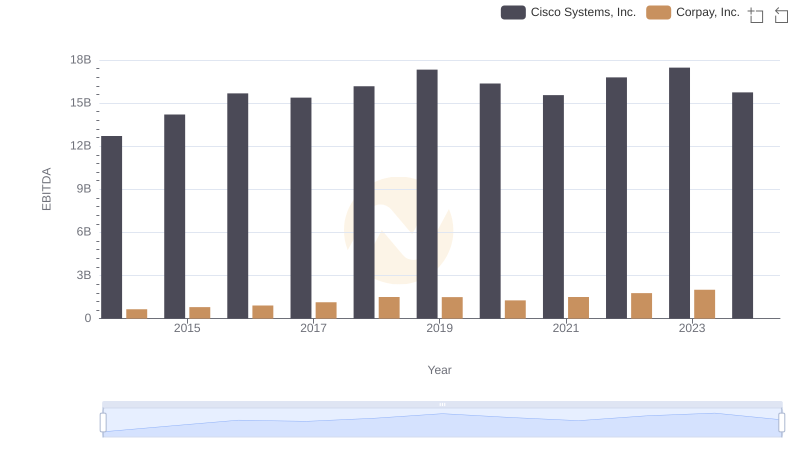
EBITDA Metrics Evaluated: Cisco Systems, Inc. vs Corpay, Inc.
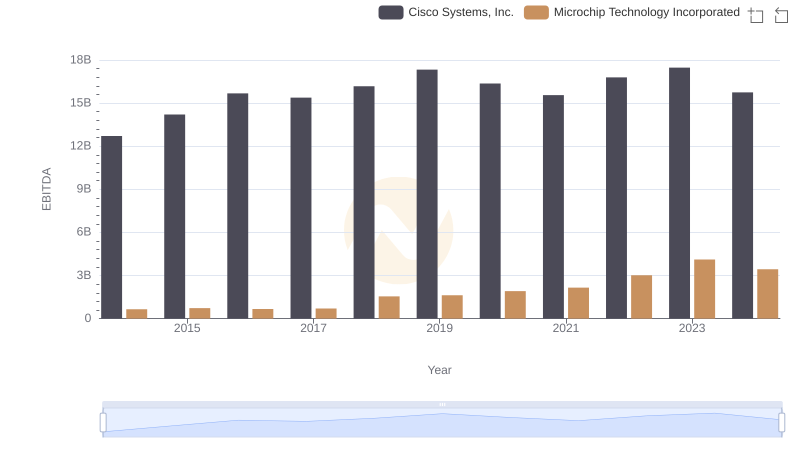
A Side-by-Side Analysis of EBITDA: Cisco Systems, Inc. and Microchip Technology Incorporated

EBITDA Metrics Evaluated: Cisco Systems, Inc. vs Monolithic Power Systems, Inc.
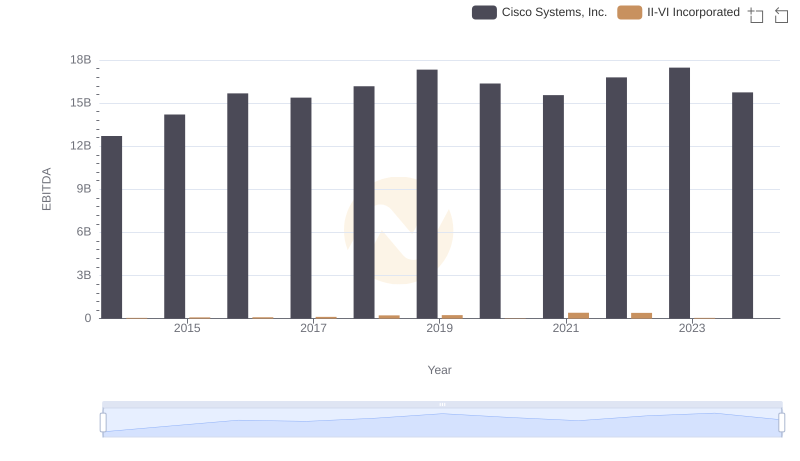
EBITDA Performance Review: Cisco Systems, Inc. vs II-VI Incorporated
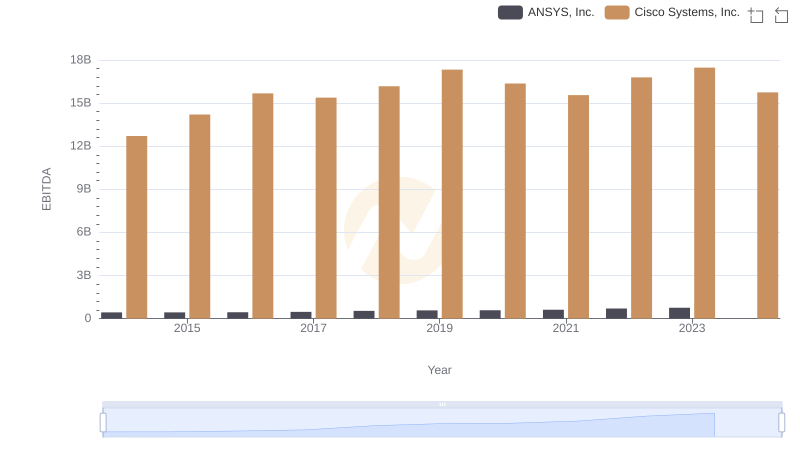
A Side-by-Side Analysis of EBITDA: Cisco Systems, Inc. and ANSYS, Inc.
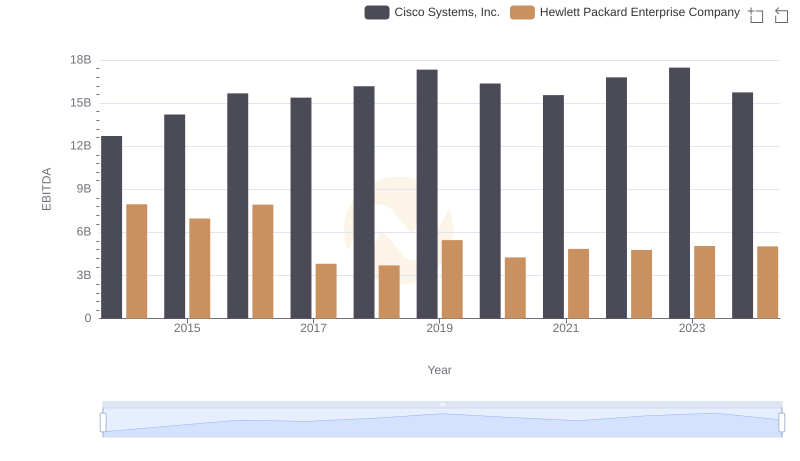
Comparative EBITDA Analysis: Cisco Systems, Inc. vs Hewlett Packard Enterprise Company