| __timestamp | Cisco Systems, Inc. | Microchip Technology Incorporated |
|---|---|---|
| Wednesday, January 1, 2014 | 12709000000 | 651027000 |
| Thursday, January 1, 2015 | 14209000000 | 731158000 |
| Friday, January 1, 2016 | 15678000000 | 668482000 |
| Sunday, January 1, 2017 | 15383000000 | 705341000 |
| Monday, January 1, 2018 | 16172000000 | 1552200000 |
| Tuesday, January 1, 2019 | 17334000000 | 1624400000 |
| Wednesday, January 1, 2020 | 16363000000 | 1909400000 |
| Friday, January 1, 2021 | 15558000000 | 2153100000 |
| Saturday, January 1, 2022 | 16794000000 | 3022600000 |
| Sunday, January 1, 2023 | 17471000000 | 4112000000 |
| Monday, January 1, 2024 | 15747000000 | 3438200000 |
Unleashing the power of data
In the ever-evolving tech industry, Cisco Systems, Inc. and Microchip Technology Incorporated have demonstrated remarkable financial resilience. Over the past decade, Cisco's EBITDA has shown a steady upward trajectory, peaking in 2023 with a 37% increase from 2014. Meanwhile, Microchip Technology has experienced an impressive growth spurt, with its EBITDA surging by over 530% during the same period.
Cisco's EBITDA growth reflects its strategic investments and market adaptability. Despite fluctuations, Cisco maintained a robust average EBITDA of approximately $15.8 billion annually, showcasing its dominance in the networking sector.
Microchip Technology's EBITDA journey is a testament to its aggressive expansion and innovation. From a modest $651 million in 2014, it reached a remarkable $4.1 billion in 2023, highlighting its growing influence in the semiconductor industry.
This side-by-side analysis underscores the dynamic nature of the tech landscape, where strategic foresight and adaptability are key to sustained growth.

Breaking Down Revenue Trends: Cisco Systems, Inc. vs Microchip Technology Incorporated
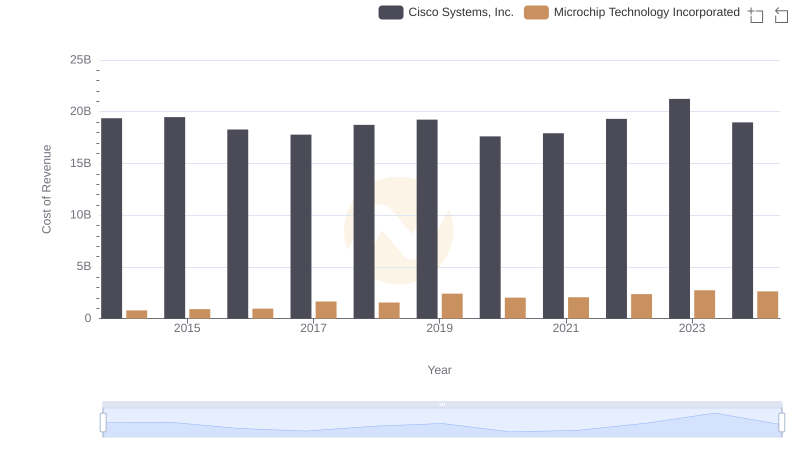
Analyzing Cost of Revenue: Cisco Systems, Inc. and Microchip Technology Incorporated
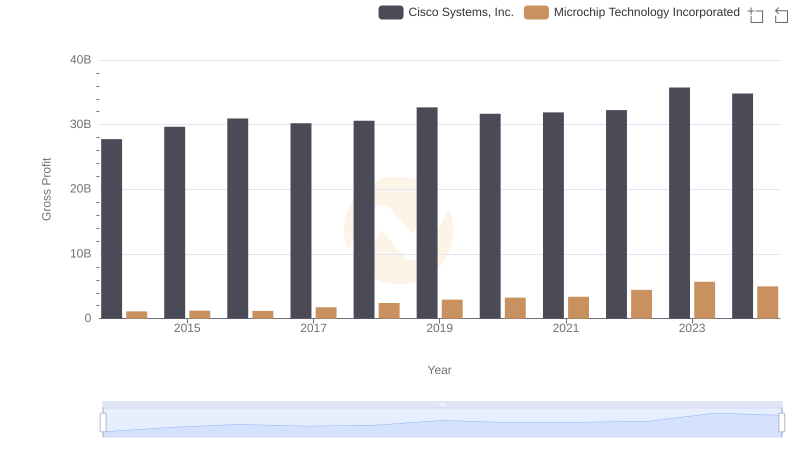
Cisco Systems, Inc. and Microchip Technology Incorporated: A Detailed Gross Profit Analysis
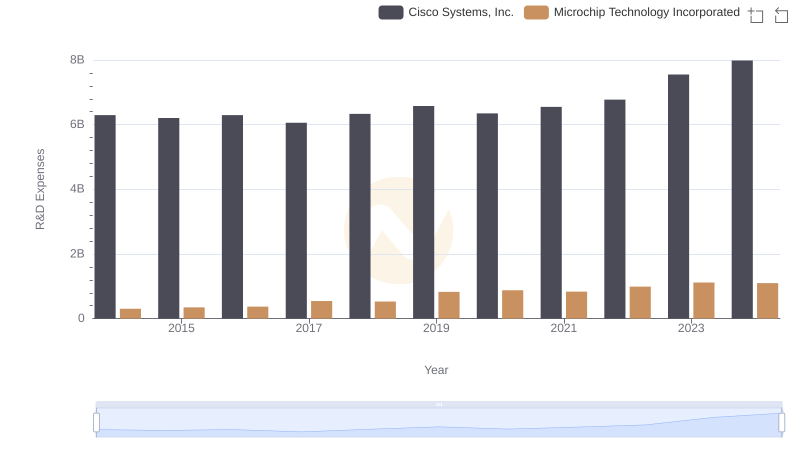
Analyzing R&D Budgets: Cisco Systems, Inc. vs Microchip Technology Incorporated
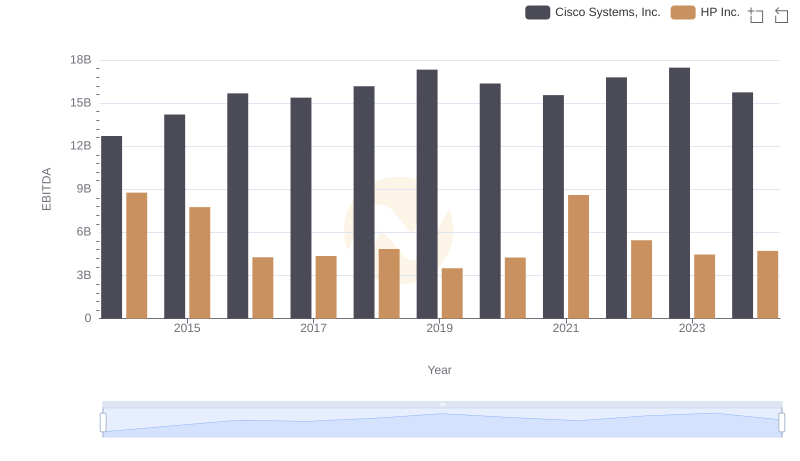
Professional EBITDA Benchmarking: Cisco Systems, Inc. vs HP Inc.
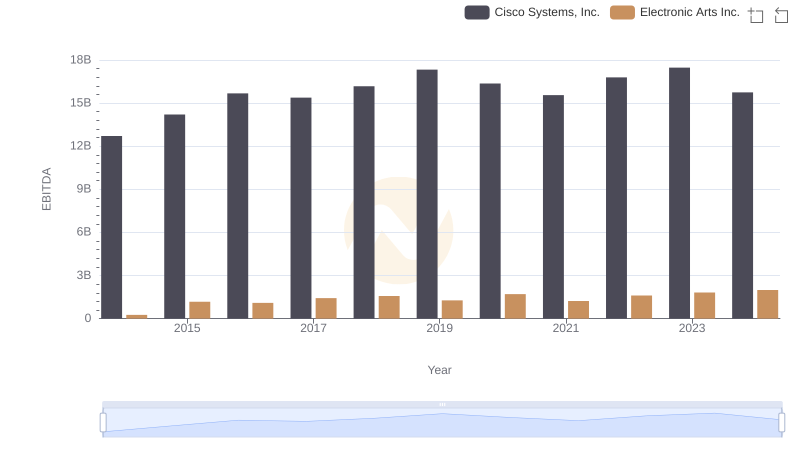
Professional EBITDA Benchmarking: Cisco Systems, Inc. vs Electronic Arts Inc.
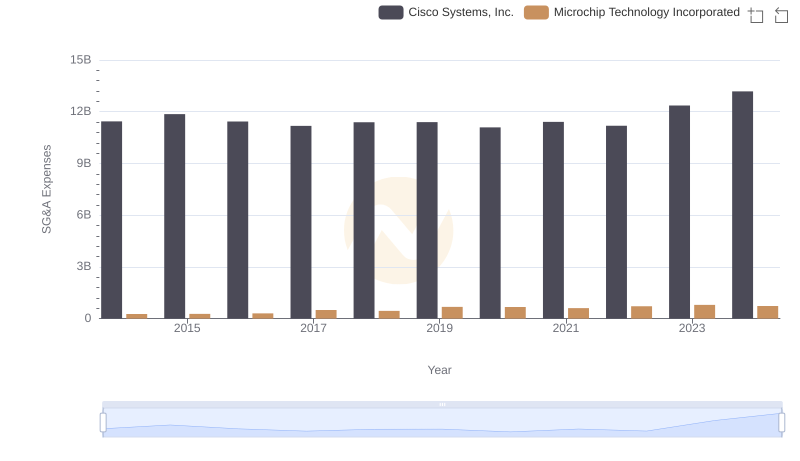
Selling, General, and Administrative Costs: Cisco Systems, Inc. vs Microchip Technology Incorporated
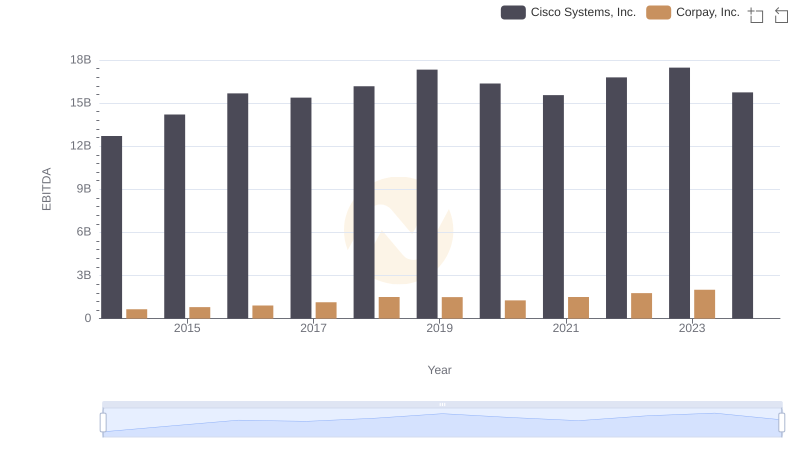
EBITDA Metrics Evaluated: Cisco Systems, Inc. vs Corpay, Inc.

EBITDA Metrics Evaluated: Cisco Systems, Inc. vs Monolithic Power Systems, Inc.
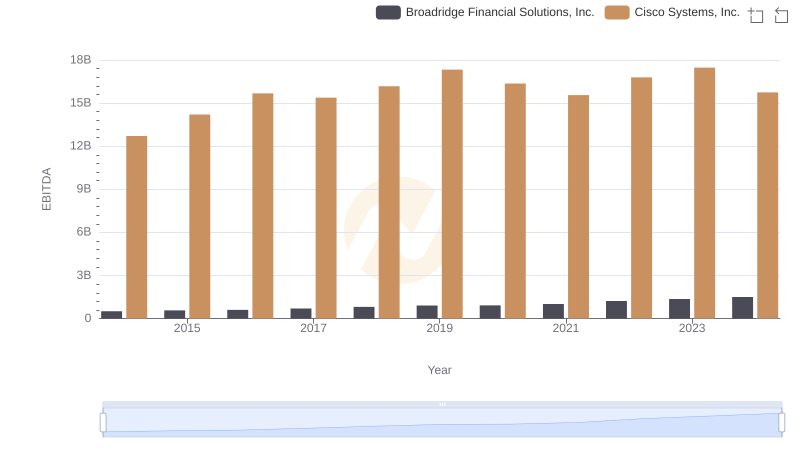
EBITDA Metrics Evaluated: Cisco Systems, Inc. vs Broadridge Financial Solutions, Inc.
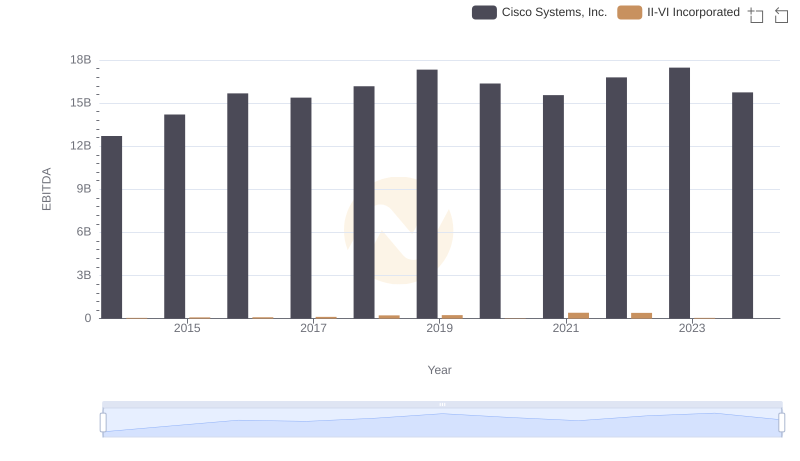
EBITDA Performance Review: Cisco Systems, Inc. vs II-VI Incorporated
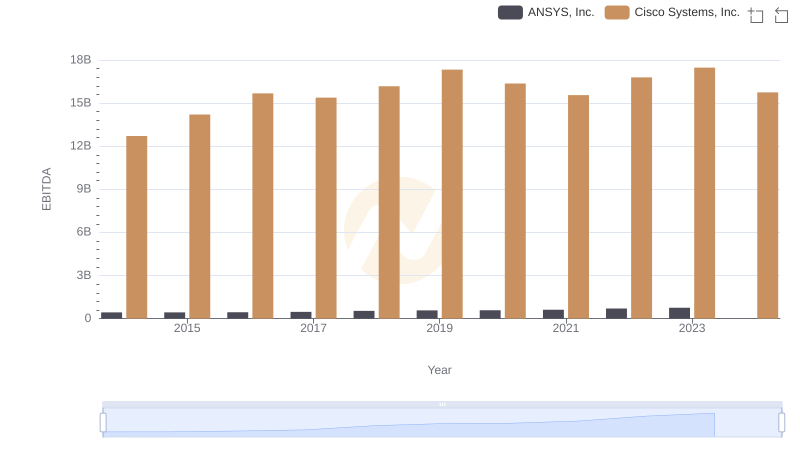
A Side-by-Side Analysis of EBITDA: Cisco Systems, Inc. and ANSYS, Inc.