| __timestamp | Cintas Corporation | Howmet Aerospace Inc. |
|---|---|---|
| Wednesday, January 1, 2014 | 793811000 | 1927000000 |
| Thursday, January 1, 2015 | 877761000 | 1936000000 |
| Friday, January 1, 2016 | 933728000 | 1457000000 |
| Sunday, January 1, 2017 | 968293000 | 1517000000 |
| Monday, January 1, 2018 | 1227852000 | 1491000000 |
| Tuesday, January 1, 2019 | 1564228000 | 843000000 |
| Wednesday, January 1, 2020 | 1542737000 | 831000000 |
| Friday, January 1, 2021 | 1773591000 | 1095000000 |
| Saturday, January 1, 2022 | 1990046000 | 1260000000 |
| Sunday, January 1, 2023 | 2221676000 | 1465000000 |
| Monday, January 1, 2024 | 2523857000 | 1842000000 |
Unveiling the hidden dimensions of data
In the competitive landscape of industrial services and aerospace, Cintas Corporation and Howmet Aerospace Inc. have showcased intriguing financial trajectories over the past decade. From 2014 to 2023, Cintas Corporation's EBITDA has surged by approximately 218%, reflecting its robust growth strategy and market adaptability. In contrast, Howmet Aerospace Inc. experienced a more volatile journey, with a notable dip in 2019 and 2020, where EBITDA fell by nearly 57% from its 2015 peak. However, a recovery trend is evident as of 2023, with a 76% increase from the 2020 low. This comparison not only highlights the resilience and strategic pivots of these industry leaders but also underscores the dynamic nature of the sectors they operate in. As we look to 2024, Cintas continues its upward trajectory, while Howmet's data remains to be seen, leaving room for speculation and anticipation.
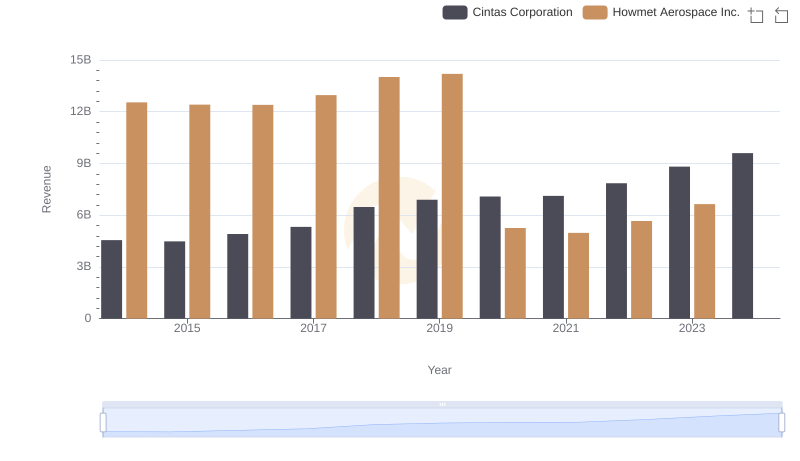
Cintas Corporation vs Howmet Aerospace Inc.: Examining Key Revenue Metrics
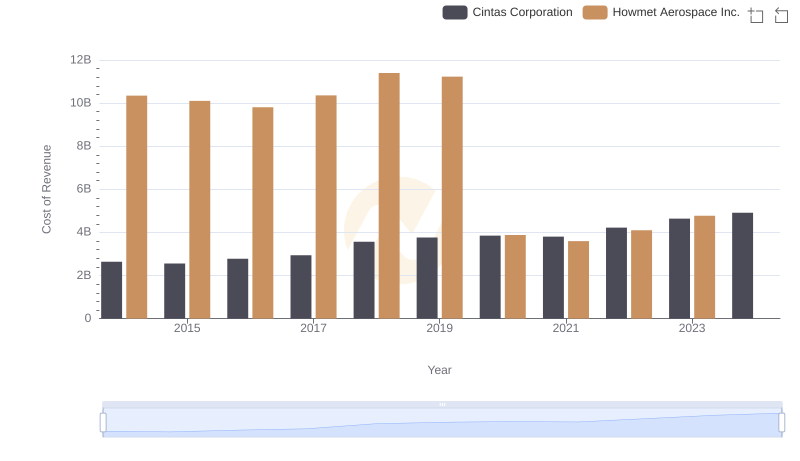
Cost of Revenue Comparison: Cintas Corporation vs Howmet Aerospace Inc.
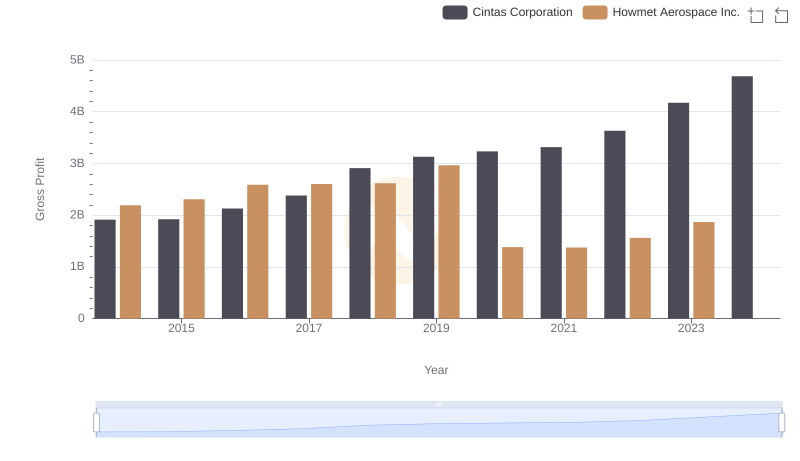
Who Generates Higher Gross Profit? Cintas Corporation or Howmet Aerospace Inc.
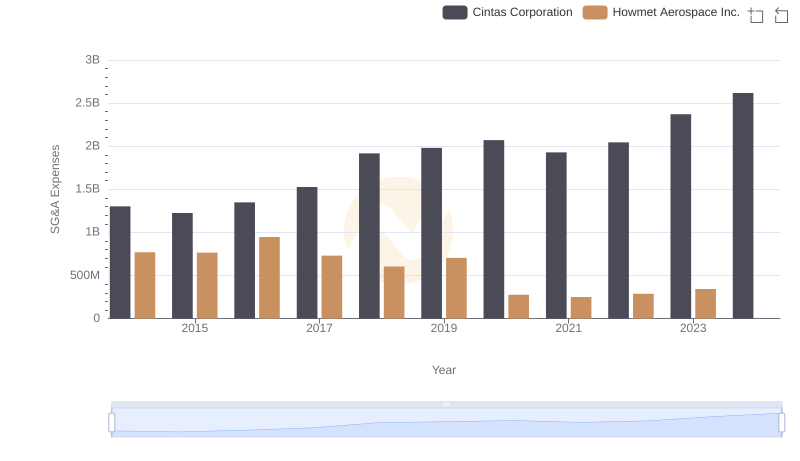
Who Optimizes SG&A Costs Better? Cintas Corporation or Howmet Aerospace Inc.
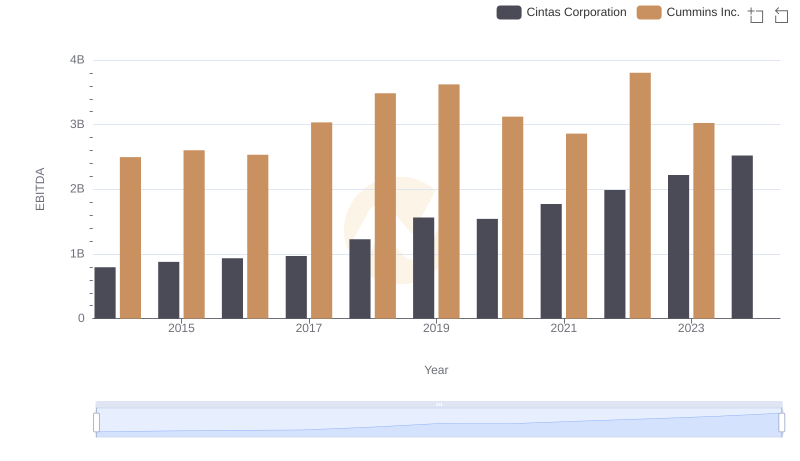
EBITDA Analysis: Evaluating Cintas Corporation Against Cummins Inc.
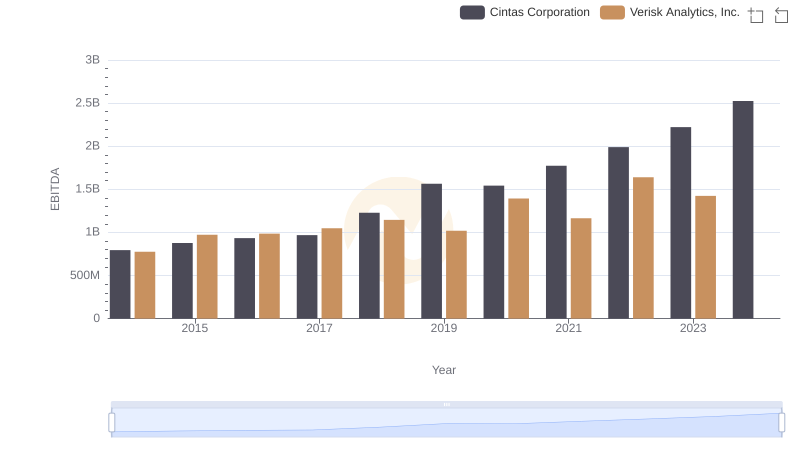
A Side-by-Side Analysis of EBITDA: Cintas Corporation and Verisk Analytics, Inc.
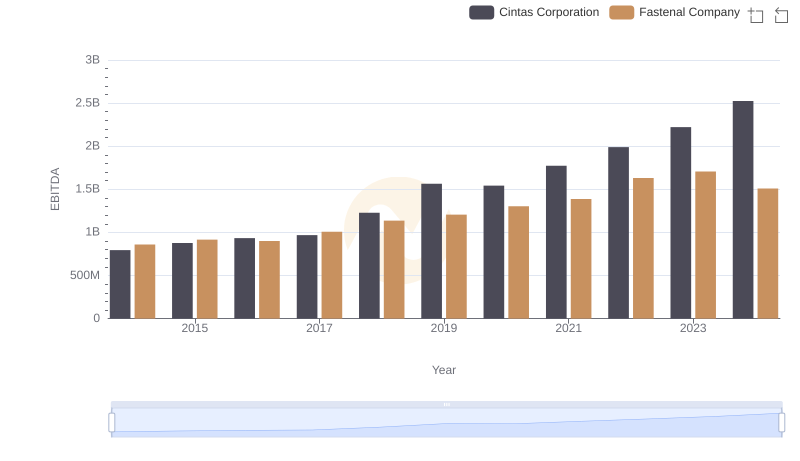
EBITDA Analysis: Evaluating Cintas Corporation Against Fastenal Company
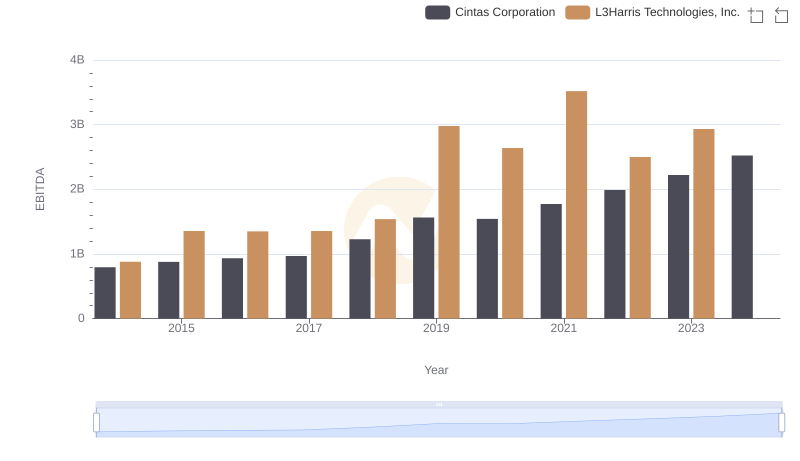
Comprehensive EBITDA Comparison: Cintas Corporation vs L3Harris Technologies, Inc.
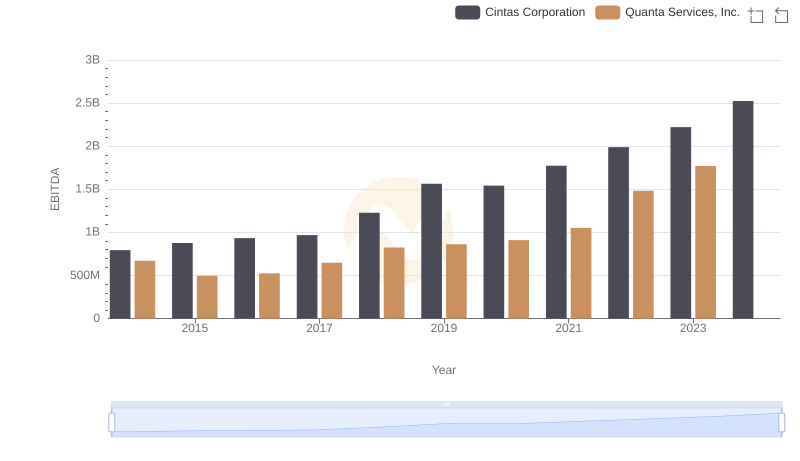
Comparative EBITDA Analysis: Cintas Corporation vs Quanta Services, Inc.
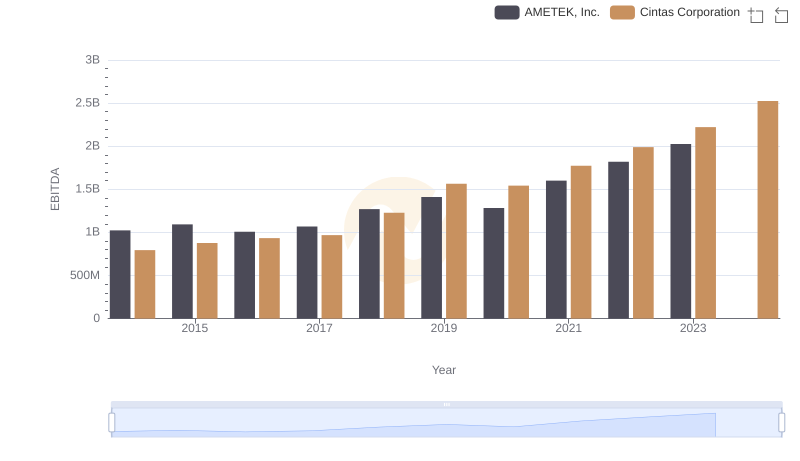
Cintas Corporation vs AMETEK, Inc.: In-Depth EBITDA Performance Comparison
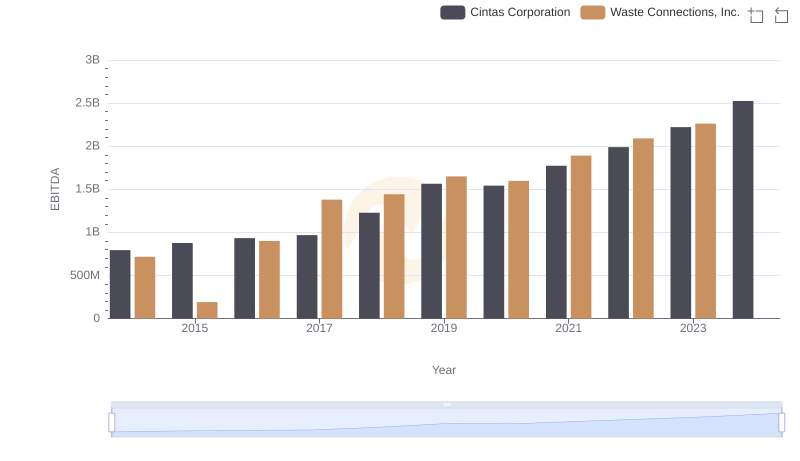
A Side-by-Side Analysis of EBITDA: Cintas Corporation and Waste Connections, Inc.
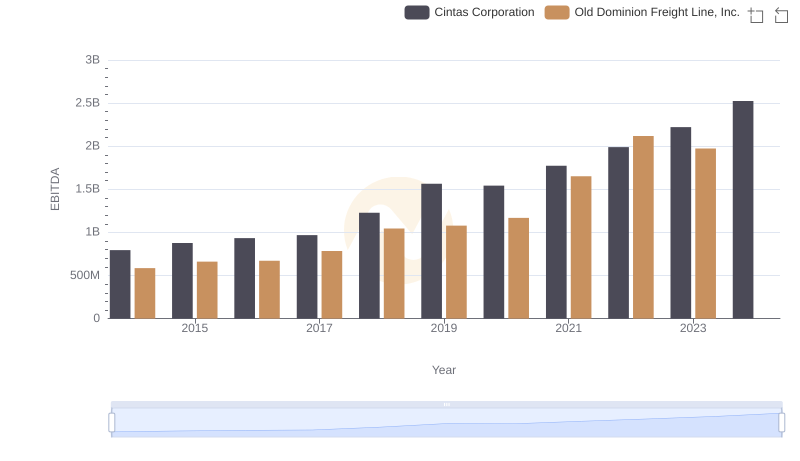
Professional EBITDA Benchmarking: Cintas Corporation vs Old Dominion Freight Line, Inc.