| __timestamp | AMETEK, Inc. | Cintas Corporation |
|---|---|---|
| Wednesday, January 1, 2014 | 1023344000 | 793811000 |
| Thursday, January 1, 2015 | 1093776000 | 877761000 |
| Friday, January 1, 2016 | 1007213000 | 933728000 |
| Sunday, January 1, 2017 | 1068174000 | 968293000 |
| Monday, January 1, 2018 | 1269415000 | 1227852000 |
| Tuesday, January 1, 2019 | 1411422000 | 1564228000 |
| Wednesday, January 1, 2020 | 1283159000 | 1542737000 |
| Friday, January 1, 2021 | 1600782000 | 1773591000 |
| Saturday, January 1, 2022 | 1820119000 | 1990046000 |
| Sunday, January 1, 2023 | 2025843000 | 2221676000 |
| Monday, January 1, 2024 | 1779562000 | 2523857000 |
Unleashing the power of data
In the competitive landscape of industrial services and manufacturing, Cintas Corporation and AMETEK, Inc. have emerged as formidable players. Over the past decade, these companies have demonstrated remarkable growth in EBITDA, a key indicator of financial health. From 2014 to 2023, Cintas Corporation's EBITDA surged by approximately 180%, reflecting its robust operational efficiency and market expansion. Meanwhile, AMETEK, Inc. showcased a steady climb, with a 98% increase in the same period, underscoring its resilience and strategic acquisitions.
Notably, in 2023, Cintas Corporation outpaced AMETEK, Inc. with an EBITDA of 2.22 billion, compared to AMETEK's 2.03 billion. This trend highlights Cintas's aggressive growth strategy. However, the data for 2024 reveals a gap for AMETEK, suggesting potential challenges or reporting delays. As these giants continue to evolve, their financial trajectories offer valuable insights into the industrial sector's dynamics.
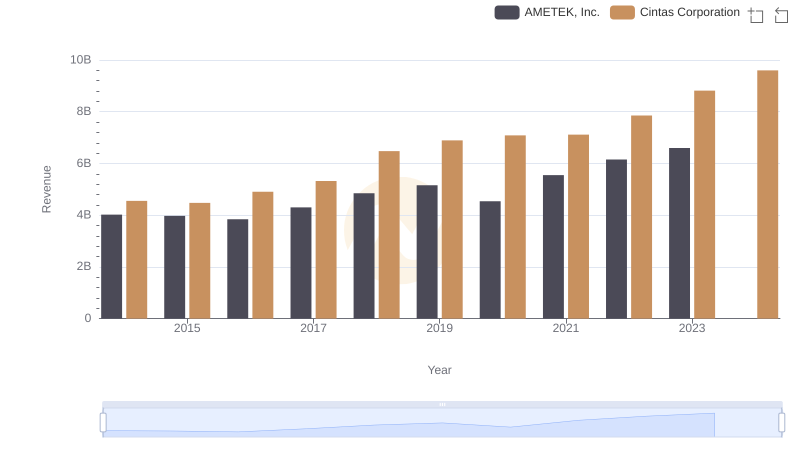
Cintas Corporation vs AMETEK, Inc.: Examining Key Revenue Metrics
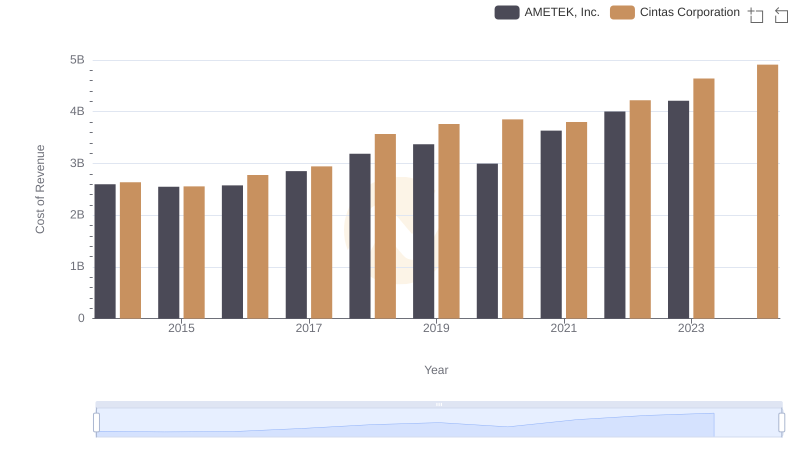
Analyzing Cost of Revenue: Cintas Corporation and AMETEK, Inc.
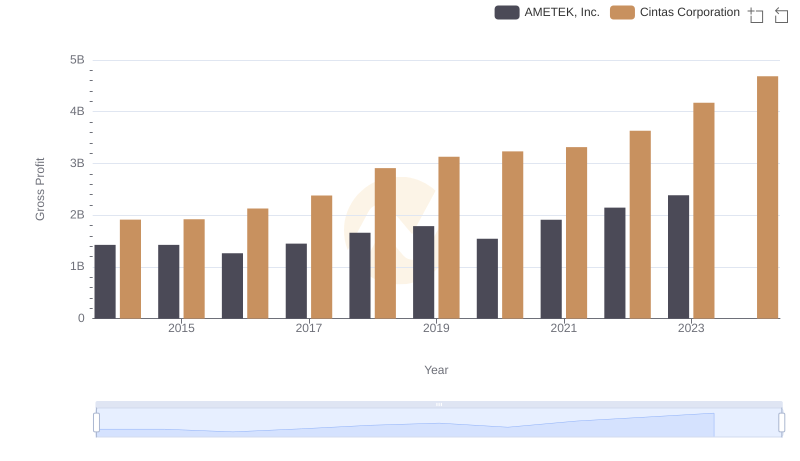
Cintas Corporation vs AMETEK, Inc.: A Gross Profit Performance Breakdown
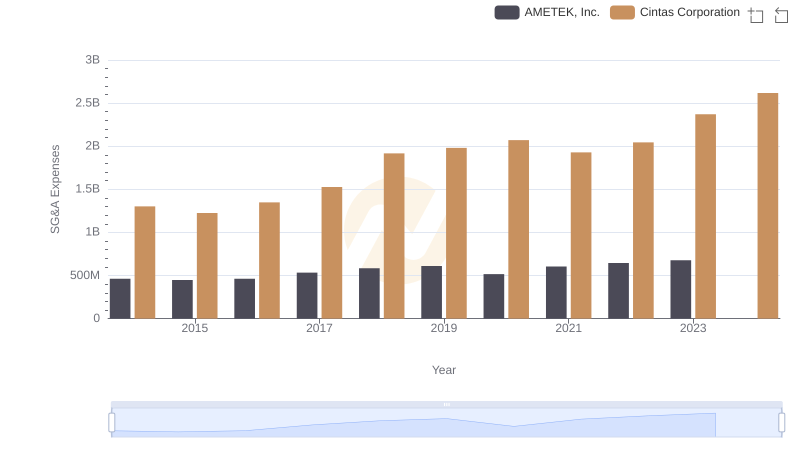
Cintas Corporation vs AMETEK, Inc.: SG&A Expense Trends
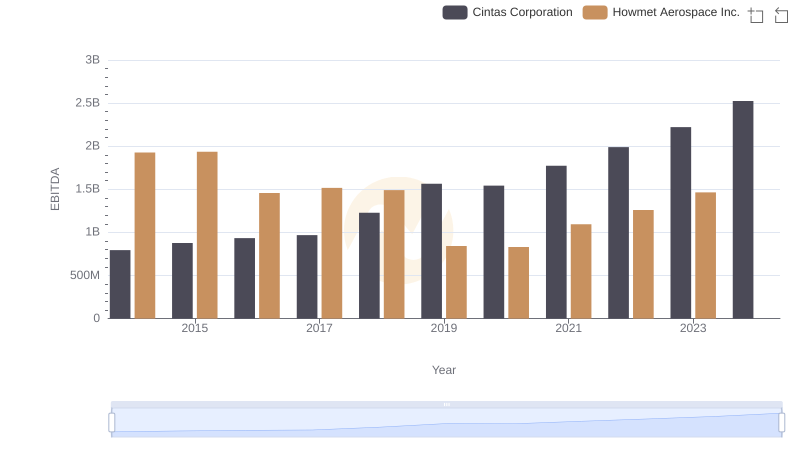
Professional EBITDA Benchmarking: Cintas Corporation vs Howmet Aerospace Inc.
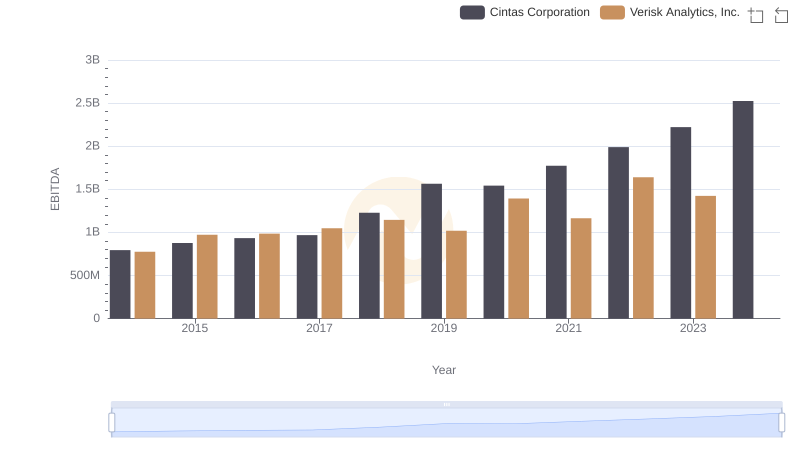
A Side-by-Side Analysis of EBITDA: Cintas Corporation and Verisk Analytics, Inc.
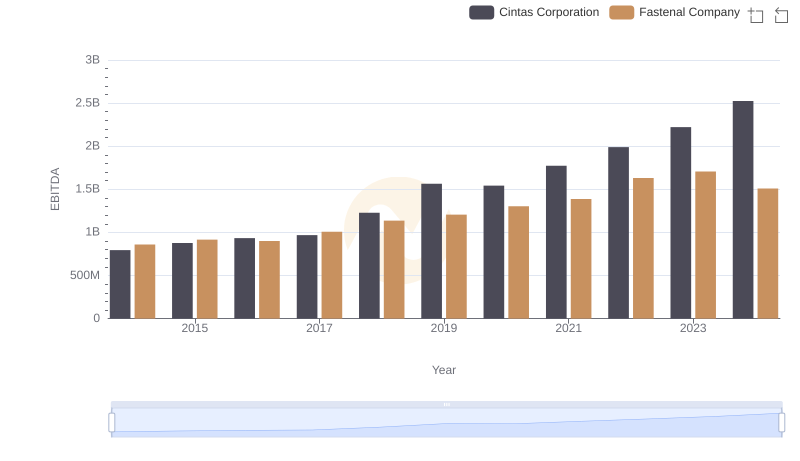
EBITDA Analysis: Evaluating Cintas Corporation Against Fastenal Company
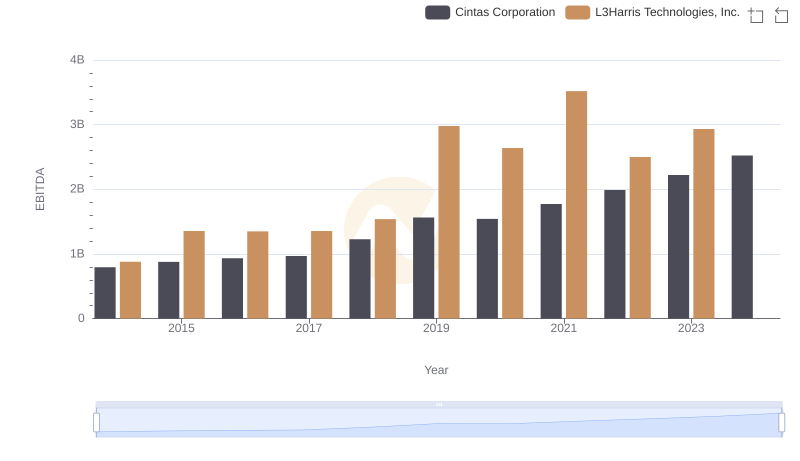
Comprehensive EBITDA Comparison: Cintas Corporation vs L3Harris Technologies, Inc.
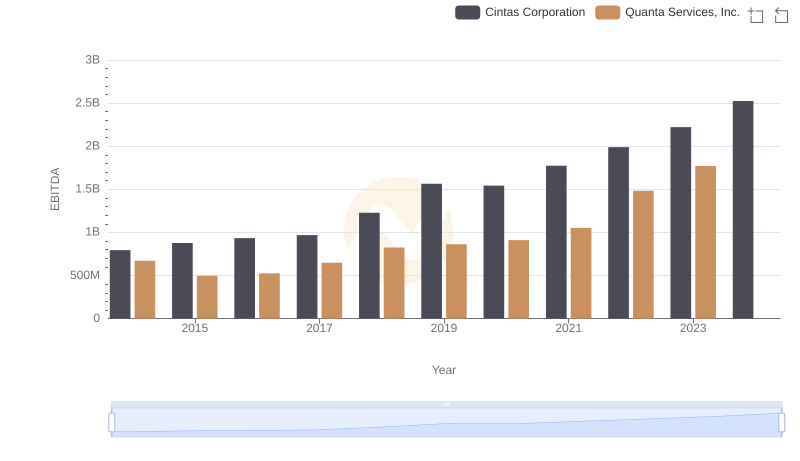
Comparative EBITDA Analysis: Cintas Corporation vs Quanta Services, Inc.
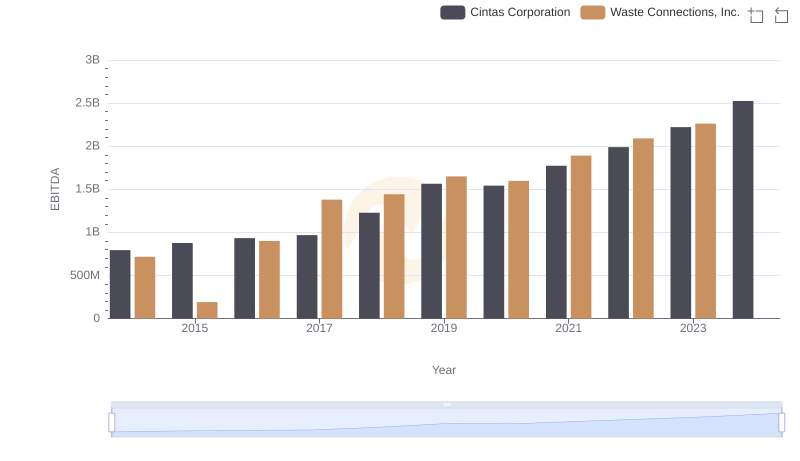
A Side-by-Side Analysis of EBITDA: Cintas Corporation and Waste Connections, Inc.
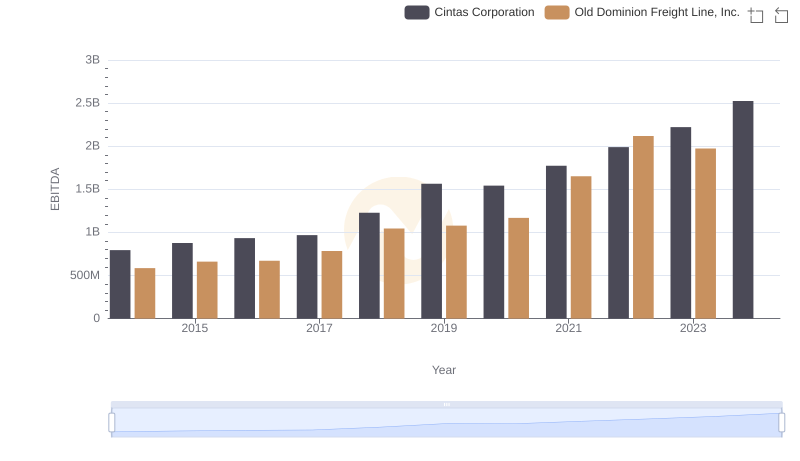
Professional EBITDA Benchmarking: Cintas Corporation vs Old Dominion Freight Line, Inc.
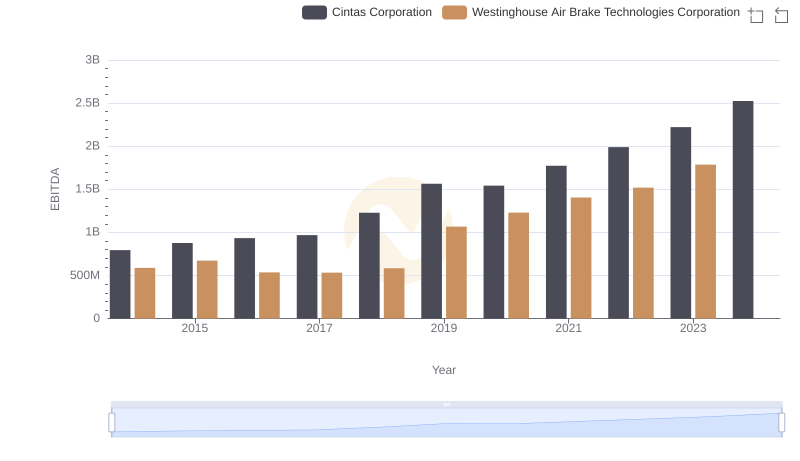
Comprehensive EBITDA Comparison: Cintas Corporation vs Westinghouse Air Brake Technologies Corporation