| __timestamp | Cintas Corporation | United Rentals, Inc. |
|---|---|---|
| Wednesday, January 1, 2014 | 793811000 | 1678000000 |
| Thursday, January 1, 2015 | 877761000 | 2653000000 |
| Friday, January 1, 2016 | 933728000 | 2566000000 |
| Sunday, January 1, 2017 | 968293000 | 2843000000 |
| Monday, January 1, 2018 | 1227852000 | 3628000000 |
| Tuesday, January 1, 2019 | 1564228000 | 4200000000 |
| Wednesday, January 1, 2020 | 1542737000 | 2195000000 |
| Friday, January 1, 2021 | 1773591000 | 2642000000 |
| Saturday, January 1, 2022 | 1990046000 | 5464000000 |
| Sunday, January 1, 2023 | 2221676000 | 6627000000 |
| Monday, January 1, 2024 | 2523857000 | 4516000000 |
In pursuit of knowledge
In the competitive landscape of corporate America, Cintas Corporation and United Rentals, Inc. have emerged as formidable players. Over the past decade, from 2014 to 2024, these companies have demonstrated significant growth in their EBITDA, a key indicator of financial health and operational efficiency.
Cintas Corporation has shown a consistent upward trajectory, with its EBITDA growing by approximately 218% from 2014 to 2024. This steady climb reflects Cintas's strategic focus on expanding its service offerings and enhancing operational efficiencies.
United Rentals, Inc. has outpaced Cintas with a remarkable 295% increase in EBITDA over the same period. This growth underscores United Rentals' aggressive expansion strategy and its ability to capitalize on the booming construction and industrial sectors.
Both companies have navigated economic fluctuations with resilience, showcasing their ability to adapt and thrive in a dynamic market environment.
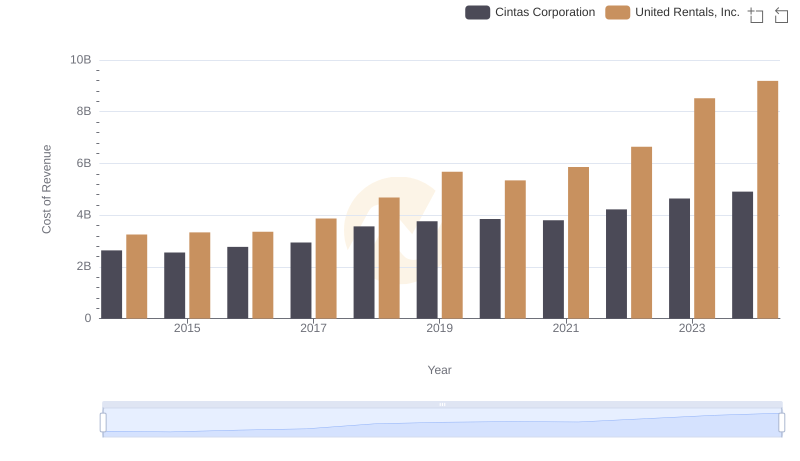
Comparing Cost of Revenue Efficiency: Cintas Corporation vs United Rentals, Inc.
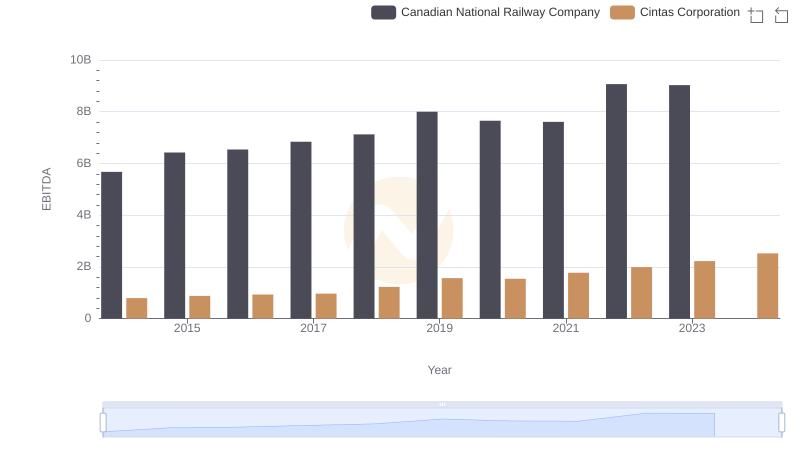
Professional EBITDA Benchmarking: Cintas Corporation vs Canadian National Railway Company
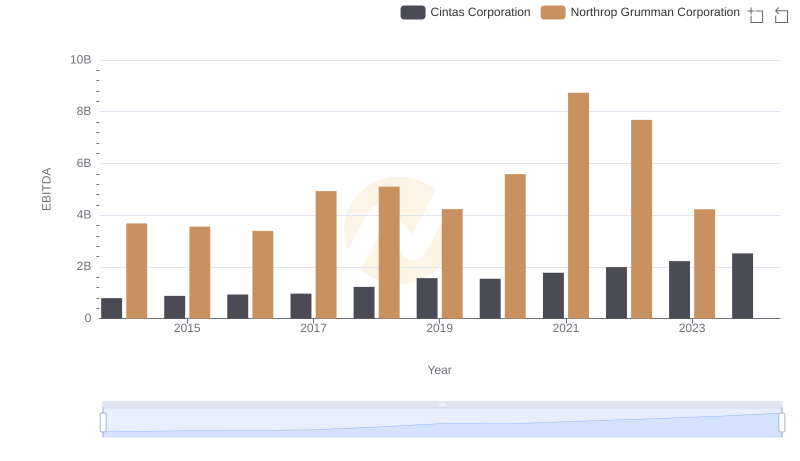
Comparative EBITDA Analysis: Cintas Corporation vs Northrop Grumman Corporation
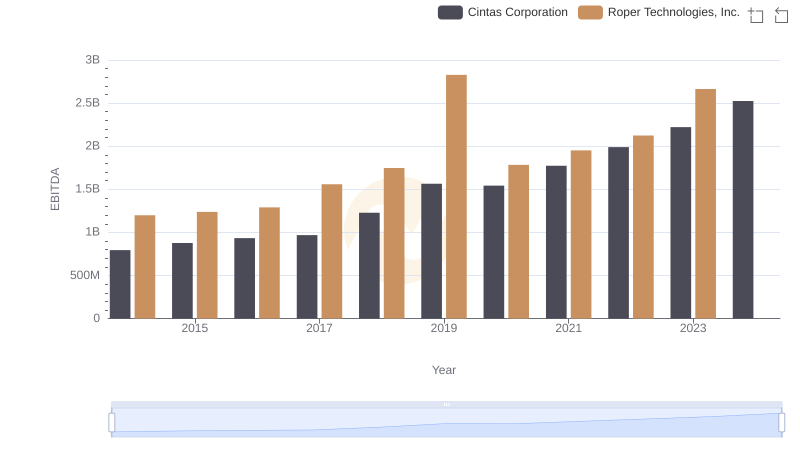
Comprehensive EBITDA Comparison: Cintas Corporation vs Roper Technologies, Inc.
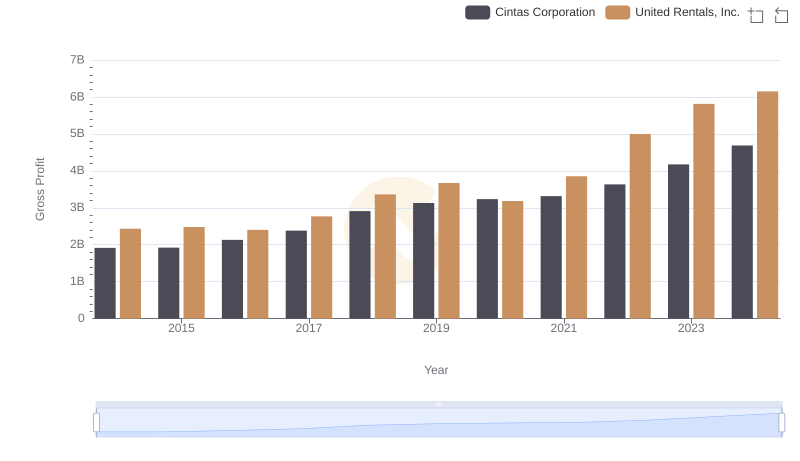
Gross Profit Analysis: Comparing Cintas Corporation and United Rentals, Inc.
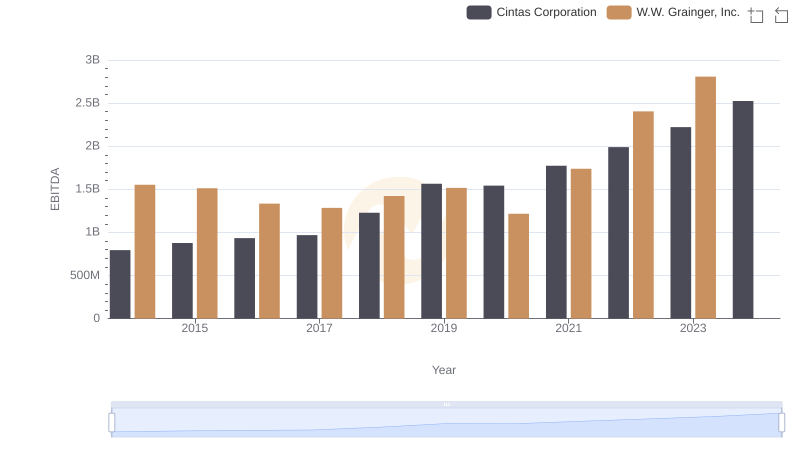
Cintas Corporation vs W.W. Grainger, Inc.: In-Depth EBITDA Performance Comparison
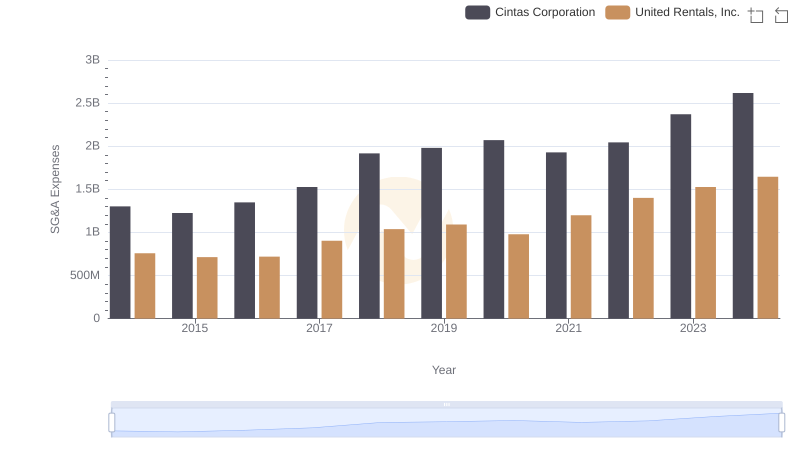
Cost Management Insights: SG&A Expenses for Cintas Corporation and United Rentals, Inc.
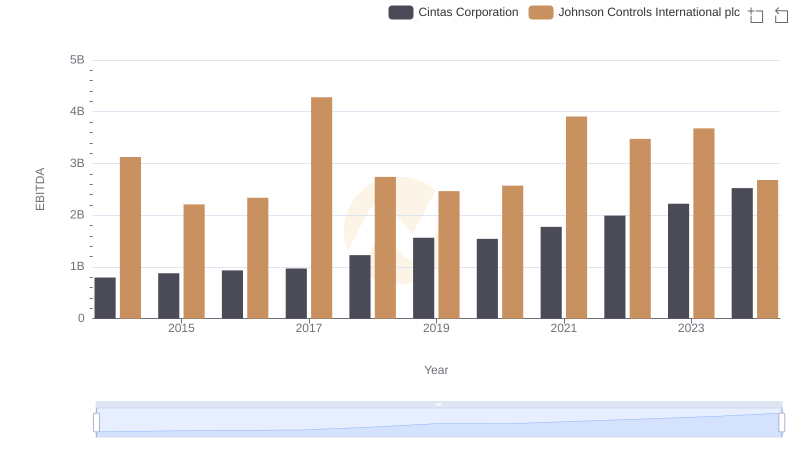
EBITDA Performance Review: Cintas Corporation vs Johnson Controls International plc
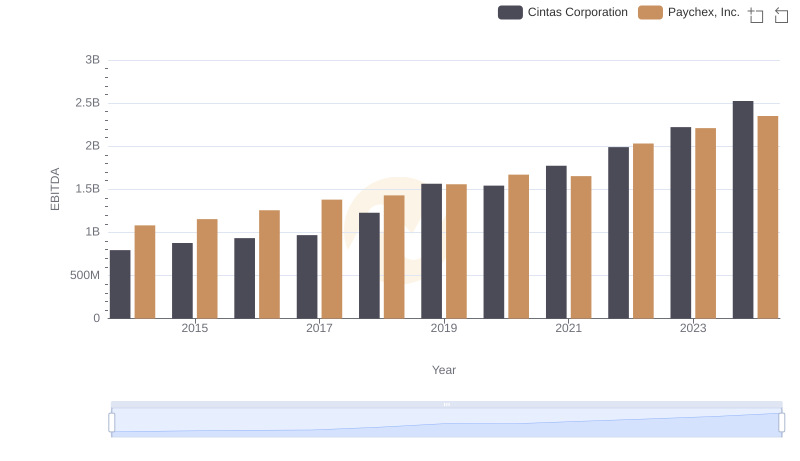
Comparative EBITDA Analysis: Cintas Corporation vs Paychex, Inc.
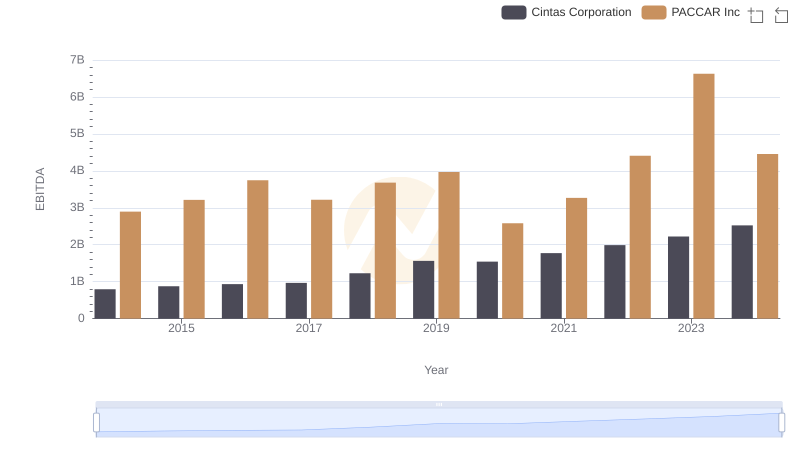
Cintas Corporation vs PACCAR Inc: In-Depth EBITDA Performance Comparison
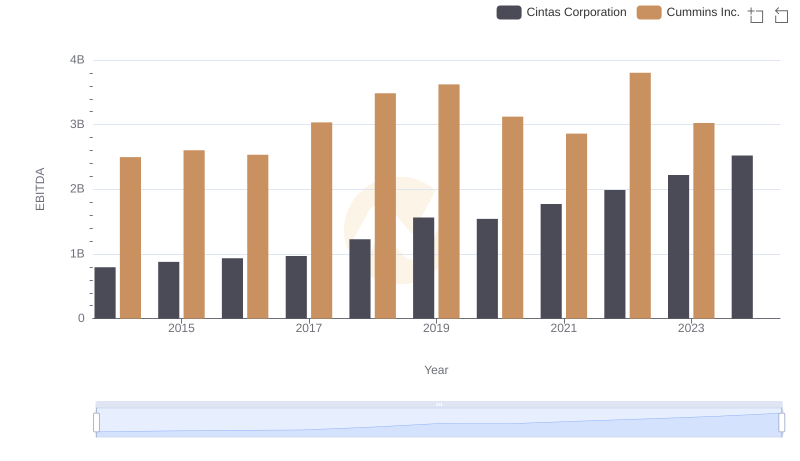
EBITDA Analysis: Evaluating Cintas Corporation Against Cummins Inc.