| __timestamp | Automatic Data Processing, Inc. | Saia, Inc. |
|---|---|---|
| Wednesday, January 1, 2014 | 2616900000 | 144715000 |
| Thursday, January 1, 2015 | 2355100000 | 154995000 |
| Friday, January 1, 2016 | 2579500000 | 156092000 |
| Sunday, January 1, 2017 | 2927200000 | 181629000 |
| Monday, January 1, 2018 | 2762900000 | 243709000 |
| Tuesday, January 1, 2019 | 3544500000 | 271318000 |
| Wednesday, January 1, 2020 | 3769700000 | 312448000 |
| Friday, January 1, 2021 | 3931600000 | 472947000 |
| Saturday, January 1, 2022 | 4405500000 | 627741000 |
| Sunday, January 1, 2023 | 5244600000 | 647607000 |
| Monday, January 1, 2024 | 5800000000 |
Unleashing insights
In the ever-evolving landscape of corporate finance, EBITDA serves as a crucial metric for evaluating a company's operational performance. This analysis delves into the EBITDA trends of Automatic Data Processing, Inc. (ADP) and Saia, Inc. from 2014 to 2023. Over this period, ADP has demonstrated a robust growth trajectory, with its EBITDA increasing by approximately 122%, from $2.6 billion in 2014 to an impressive $5.8 billion in 2023. In contrast, Saia, Inc. has shown a remarkable growth rate of over 347%, albeit from a smaller base, rising from $144 million to $648 million. This stark contrast highlights the diverse growth strategies and market dynamics influencing these companies. Notably, the data for 2024 is incomplete, suggesting potential future developments. Investors and analysts should consider these trends when assessing the financial health and strategic direction of these industry players.

Automatic Data Processing, Inc. vs Saia, Inc.: Annual Revenue Growth Compared
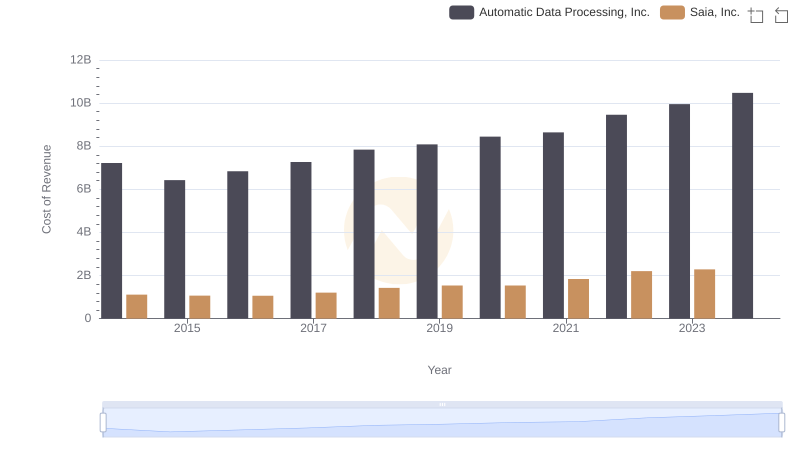
Cost Insights: Breaking Down Automatic Data Processing, Inc. and Saia, Inc.'s Expenses
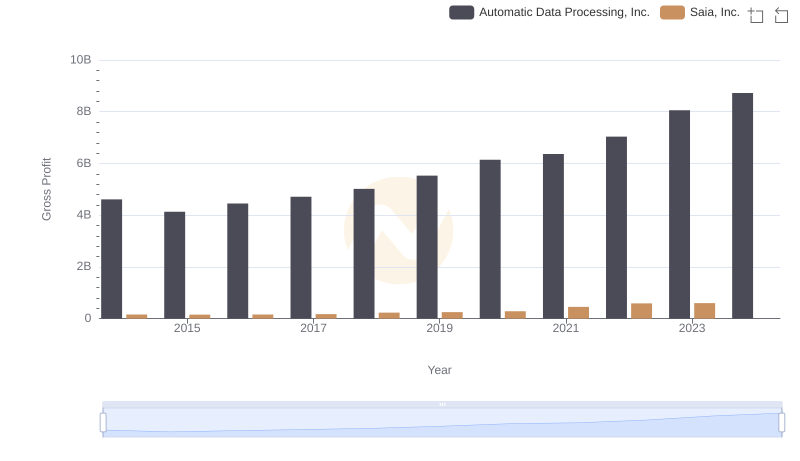
Automatic Data Processing, Inc. and Saia, Inc.: A Detailed Gross Profit Analysis

Professional EBITDA Benchmarking: Automatic Data Processing, Inc. vs Avery Dennison Corporation
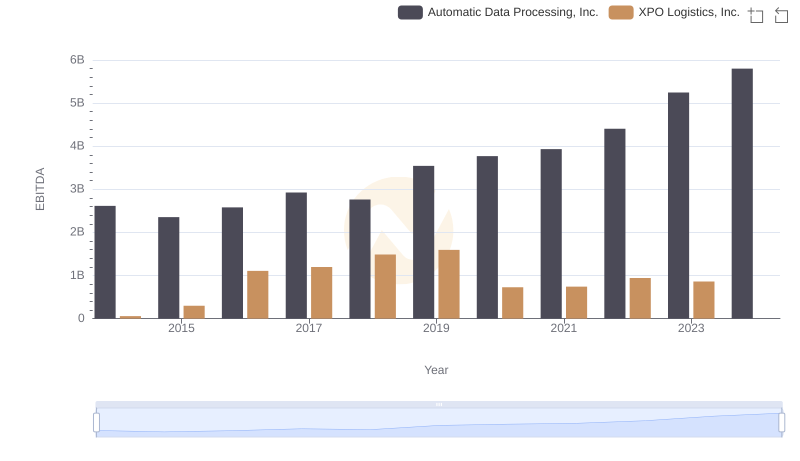
A Professional Review of EBITDA: Automatic Data Processing, Inc. Compared to XPO Logistics, Inc.

Selling, General, and Administrative Costs: Automatic Data Processing, Inc. vs Saia, Inc.
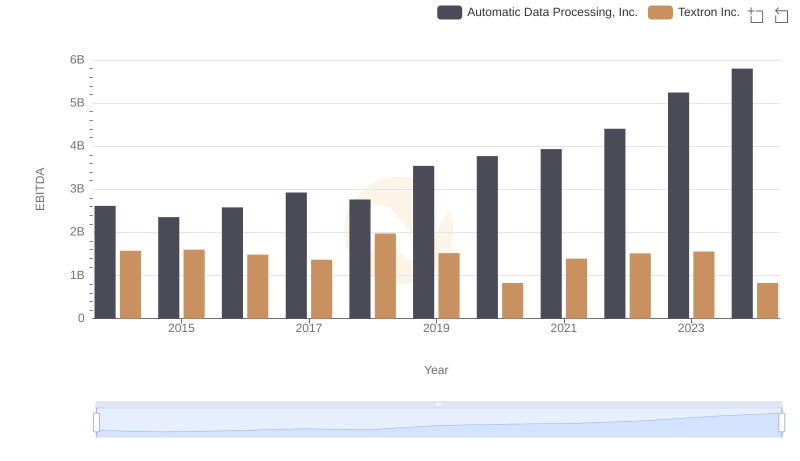
A Professional Review of EBITDA: Automatic Data Processing, Inc. Compared to Textron Inc.
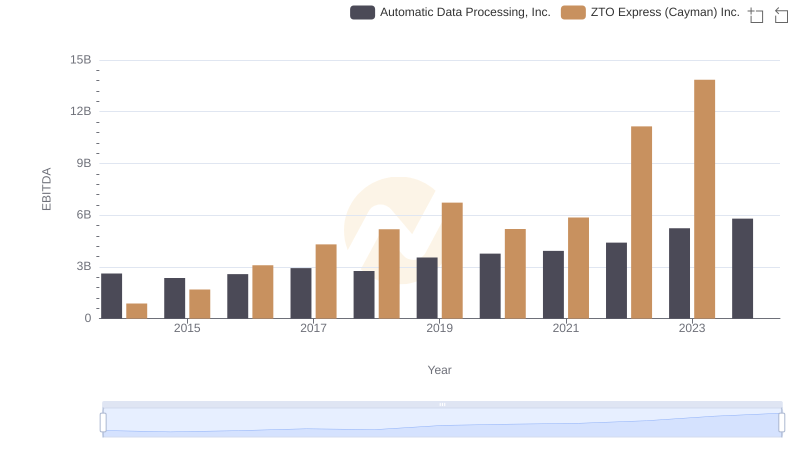
Automatic Data Processing, Inc. and ZTO Express (Cayman) Inc.: A Detailed Examination of EBITDA Performance
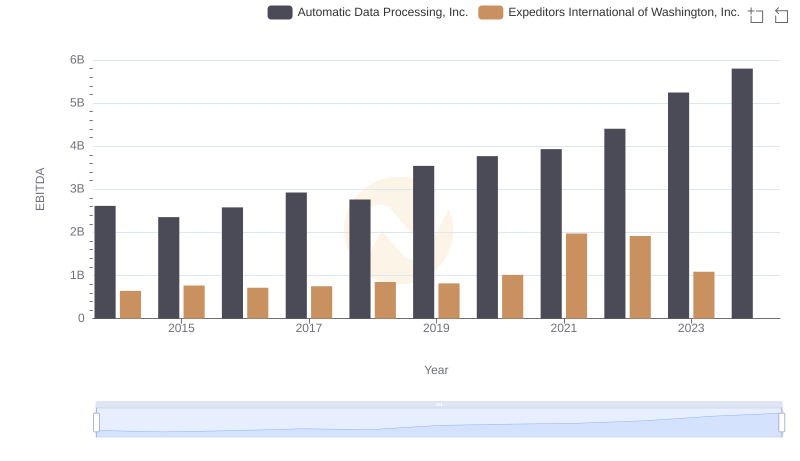
Professional EBITDA Benchmarking: Automatic Data Processing, Inc. vs Expeditors International of Washington, Inc.
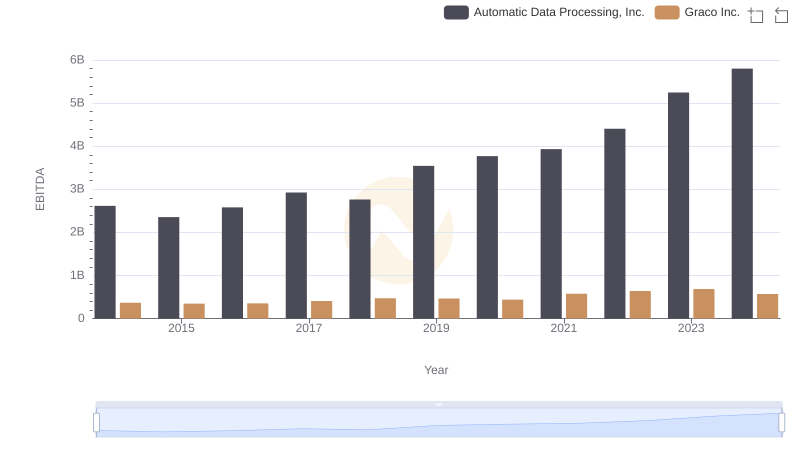
A Professional Review of EBITDA: Automatic Data Processing, Inc. Compared to Graco Inc.
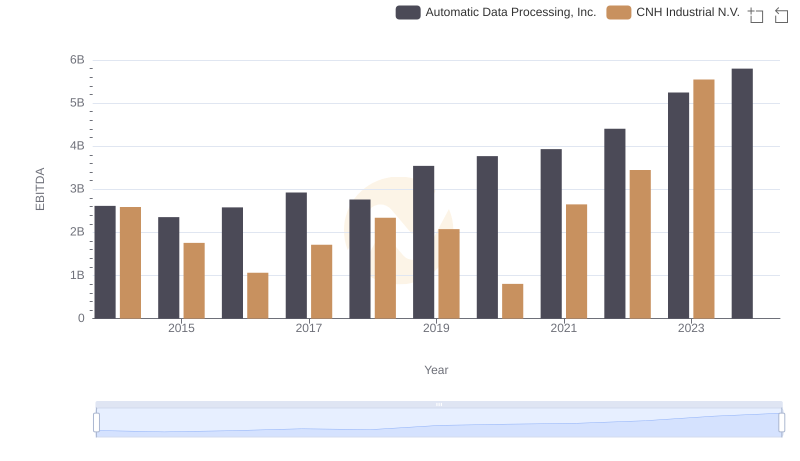
Automatic Data Processing, Inc. vs CNH Industrial N.V.: In-Depth EBITDA Performance Comparison