| __timestamp | Automatic Data Processing, Inc. | Avery Dennison Corporation |
|---|---|---|
| Wednesday, January 1, 2014 | 2616900000 | 629200000 |
| Thursday, January 1, 2015 | 2355100000 | 657700000 |
| Friday, January 1, 2016 | 2579500000 | 717000000 |
| Sunday, January 1, 2017 | 2927200000 | 829400000 |
| Monday, January 1, 2018 | 2762900000 | 794300000 |
| Tuesday, January 1, 2019 | 3544500000 | 557500000 |
| Wednesday, January 1, 2020 | 3769700000 | 1062000000 |
| Friday, January 1, 2021 | 3931600000 | 1306900000 |
| Saturday, January 1, 2022 | 4405500000 | 1374100000 |
| Sunday, January 1, 2023 | 5244600000 | 1112100000 |
| Monday, January 1, 2024 | 5800000000 | 1382700000 |
Data in motion
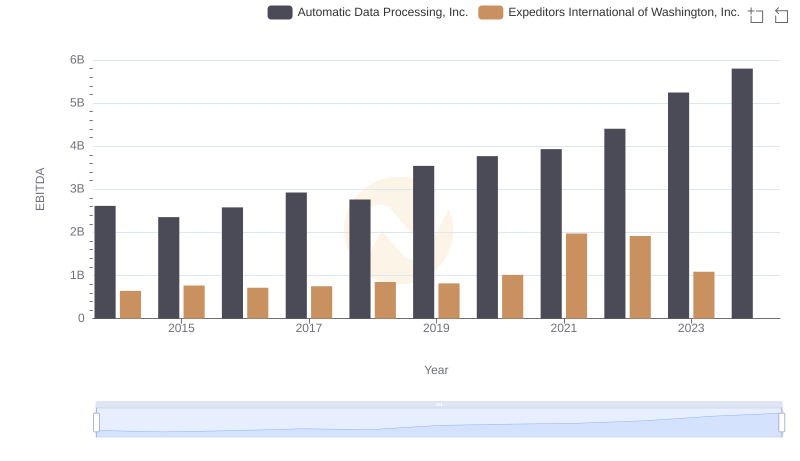
In the ever-evolving landscape of corporate finance, EBITDA serves as a crucial metric for evaluating a company's operational performance. This analysis juxtaposes the EBITDA of Automatic Data Processing, Inc. (ADP) and Avery Dennison Corporation from 2014 to 2023. Over this period, ADP demonstrated a robust growth trajectory, with its EBITDA increasing by approximately 122%, from $2.6 billion in 2014 to an impressive $5.8 billion in 2023. In contrast, Avery Dennison's EBITDA exhibited a more modest growth, peaking at $1.37 billion in 2022, before a slight decline in 2023. This disparity highlights ADP's superior operational efficiency and market adaptability. Notably, the data for 2024 is incomplete for Avery Dennison, indicating potential challenges or reporting delays. As businesses navigate the complexities of the modern economy, such insights are invaluable for stakeholders aiming to benchmark performance and strategize for future growth.
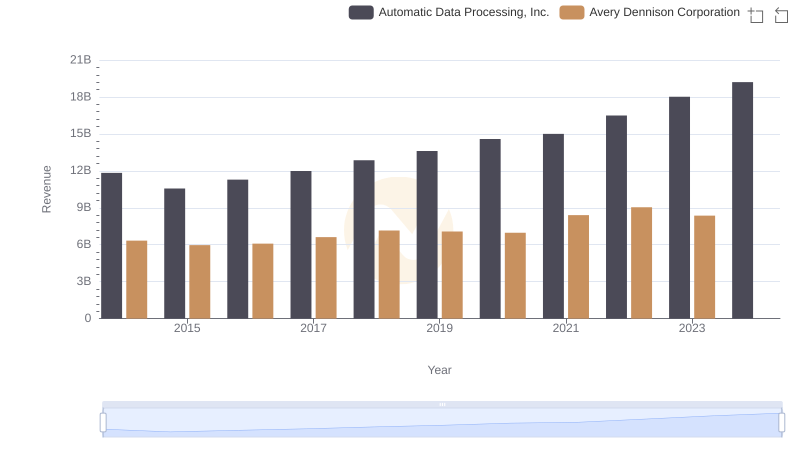
Automatic Data Processing, Inc. or Avery Dennison Corporation: Who Leads in Yearly Revenue?
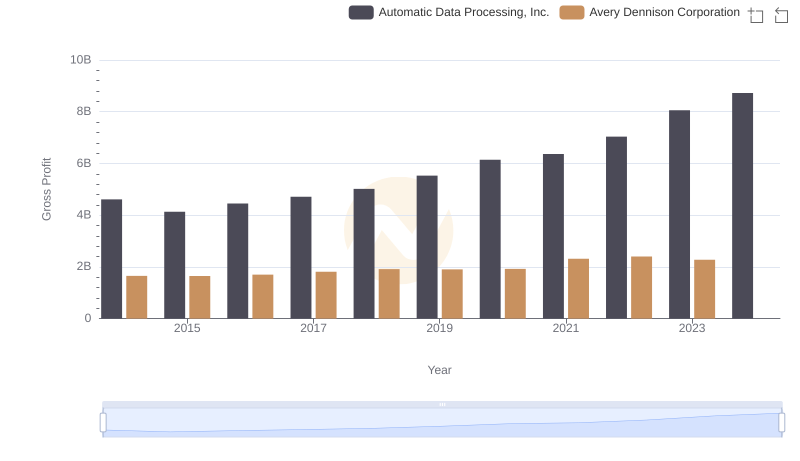
Automatic Data Processing, Inc. vs Avery Dennison Corporation: A Gross Profit Performance Breakdown
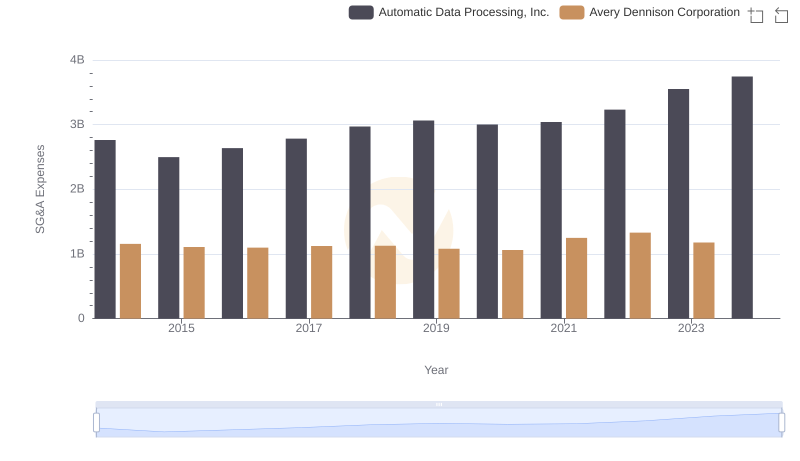
Who Optimizes SG&A Costs Better? Automatic Data Processing, Inc. or Avery Dennison Corporation
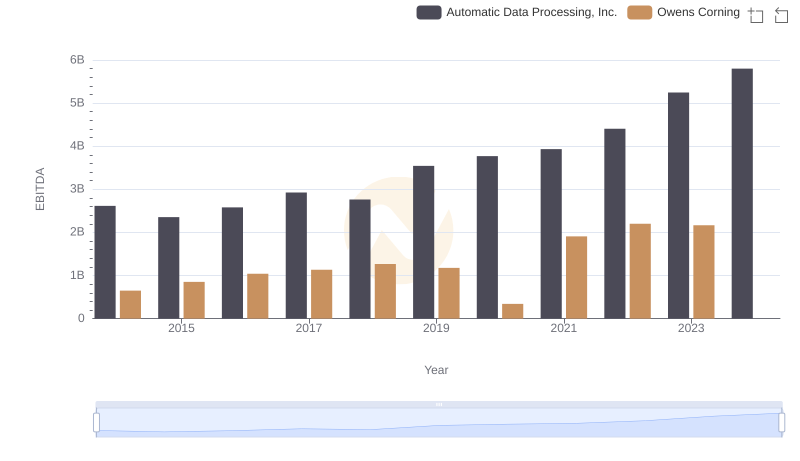
Automatic Data Processing, Inc. vs Owens Corning: In-Depth EBITDA Performance Comparison
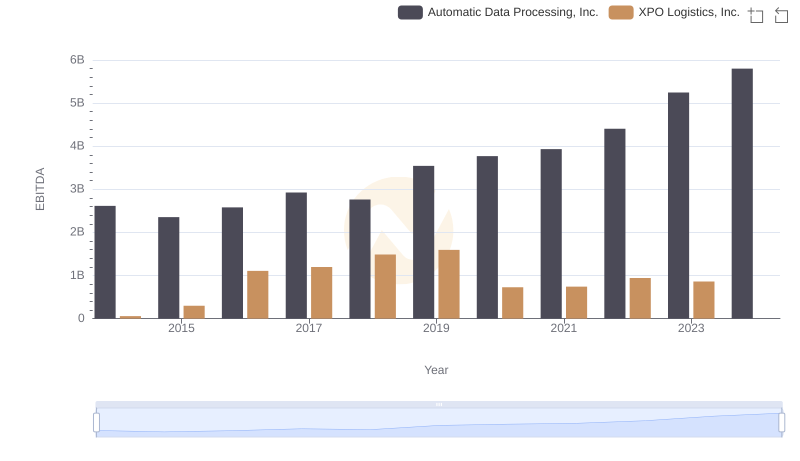
A Professional Review of EBITDA: Automatic Data Processing, Inc. Compared to XPO Logistics, Inc.
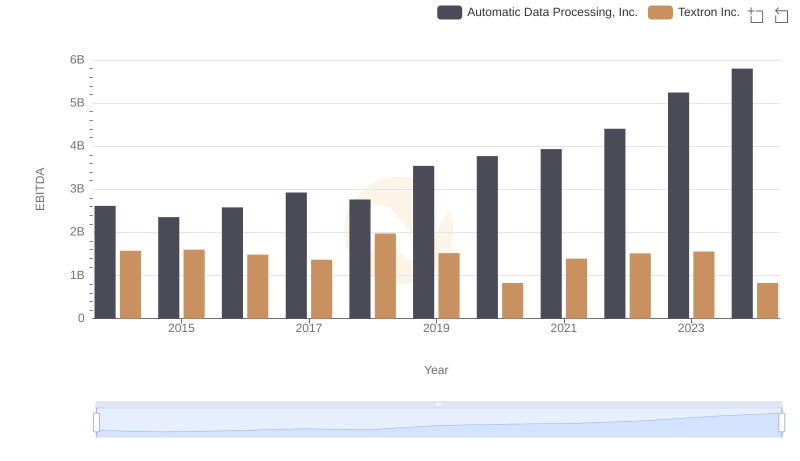
A Professional Review of EBITDA: Automatic Data Processing, Inc. Compared to Textron Inc.
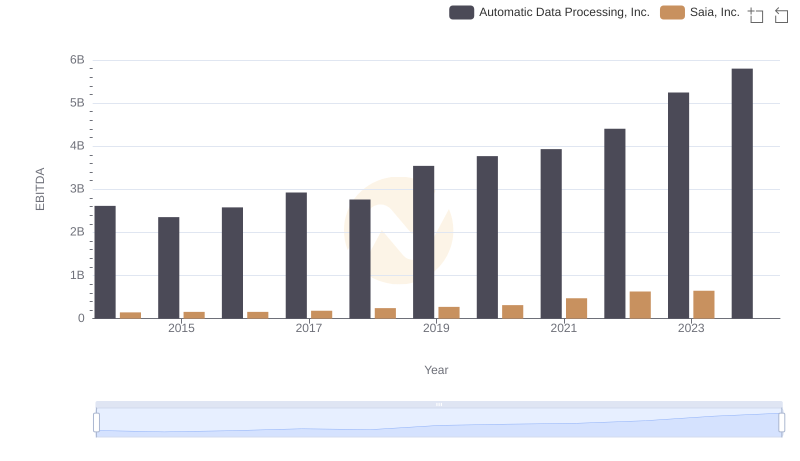
EBITDA Analysis: Evaluating Automatic Data Processing, Inc. Against Saia, Inc.
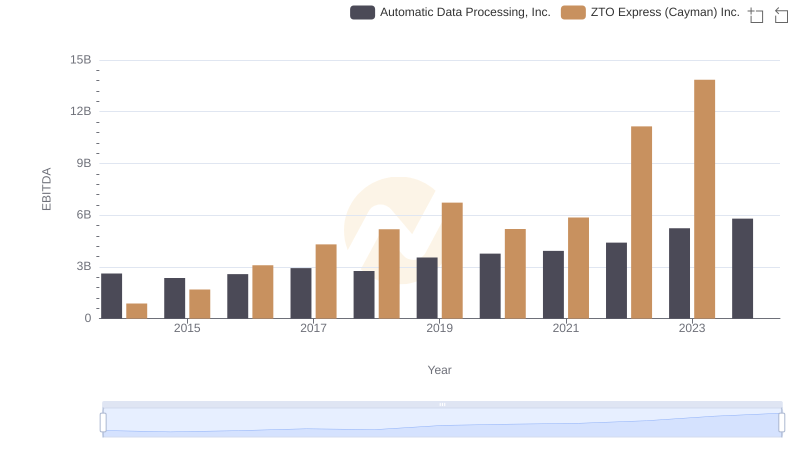
Automatic Data Processing, Inc. and ZTO Express (Cayman) Inc.: A Detailed Examination of EBITDA Performance
Professional EBITDA Benchmarking: Automatic Data Processing, Inc. vs Expeditors International of Washington, Inc.

A Professional Review of EBITDA: Automatic Data Processing, Inc. Compared to Graco Inc.