| __timestamp | Automatic Data Processing, Inc. | Graco Inc. |
|---|---|---|
| Wednesday, January 1, 2014 | 2616900000 | 369321000 |
| Thursday, January 1, 2015 | 2355100000 | 346732000 |
| Friday, January 1, 2016 | 2579500000 | 354454000 |
| Sunday, January 1, 2017 | 2927200000 | 408879000 |
| Monday, January 1, 2018 | 2762900000 | 472905000 |
| Tuesday, January 1, 2019 | 3544500000 | 466687000 |
| Wednesday, January 1, 2020 | 3769700000 | 440431000 |
| Friday, January 1, 2021 | 3931600000 | 578005000 |
| Saturday, January 1, 2022 | 4405500000 | 641618000 |
| Sunday, January 1, 2023 | 5244600000 | 686593000 |
| Monday, January 1, 2024 | 5800000000 | 570098000 |
Unlocking the unknown
In the ever-evolving landscape of corporate finance, EBITDA serves as a crucial metric for evaluating a company's operational performance. Over the past decade, Automatic Data Processing, Inc. (ADP) and Graco Inc. have demonstrated contrasting trajectories in their EBITDA growth. From 2014 to 2024, ADP's EBITDA surged by approximately 122%, reflecting its robust business model and strategic initiatives. In contrast, Graco Inc. experienced a more modest growth of around 55% during the same period.
ADP's EBITDA growth is particularly noteworthy in 2023, where it reached a peak of $5.8 billion, marking a significant leap from its 2014 figure. Meanwhile, Graco's EBITDA, although growing steadily, peaked at $686 million in 2023. This disparity highlights ADP's superior scalability and market adaptability. As we look to the future, these trends offer valuable insights for investors and stakeholders in assessing the financial health and potential of these industry giants.
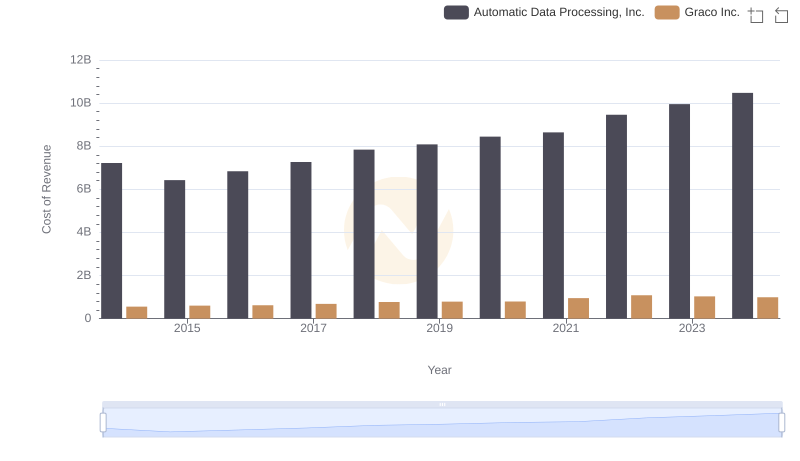
Cost of Revenue: Key Insights for Automatic Data Processing, Inc. and Graco Inc.
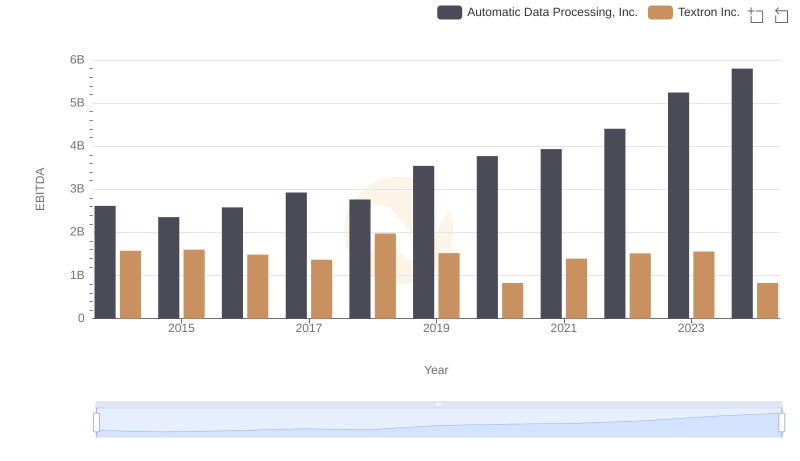
A Professional Review of EBITDA: Automatic Data Processing, Inc. Compared to Textron Inc.
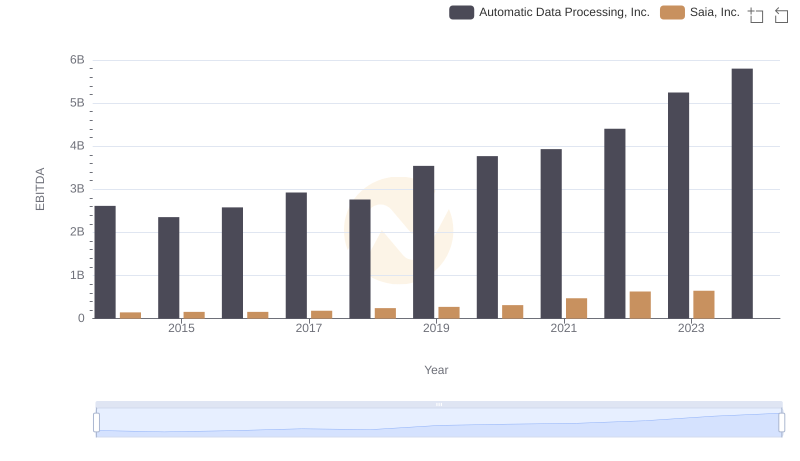
EBITDA Analysis: Evaluating Automatic Data Processing, Inc. Against Saia, Inc.
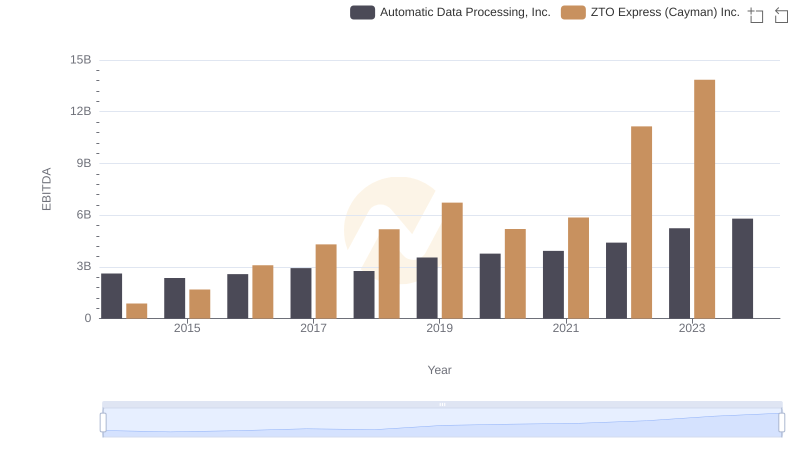
Automatic Data Processing, Inc. and ZTO Express (Cayman) Inc.: A Detailed Examination of EBITDA Performance
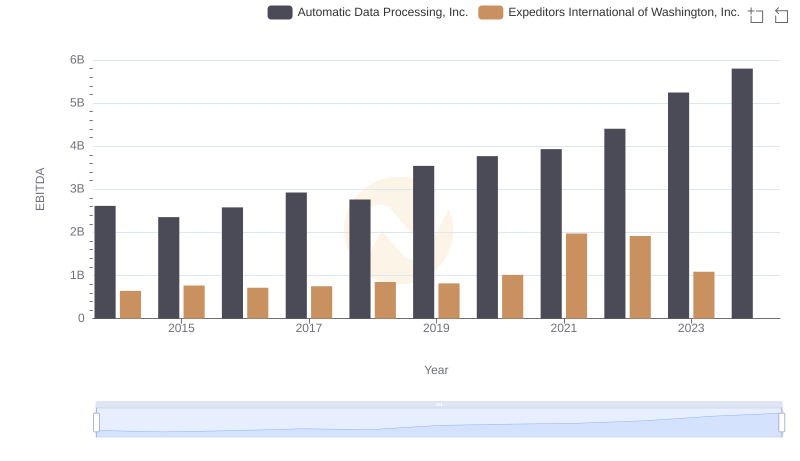
Professional EBITDA Benchmarking: Automatic Data Processing, Inc. vs Expeditors International of Washington, Inc.
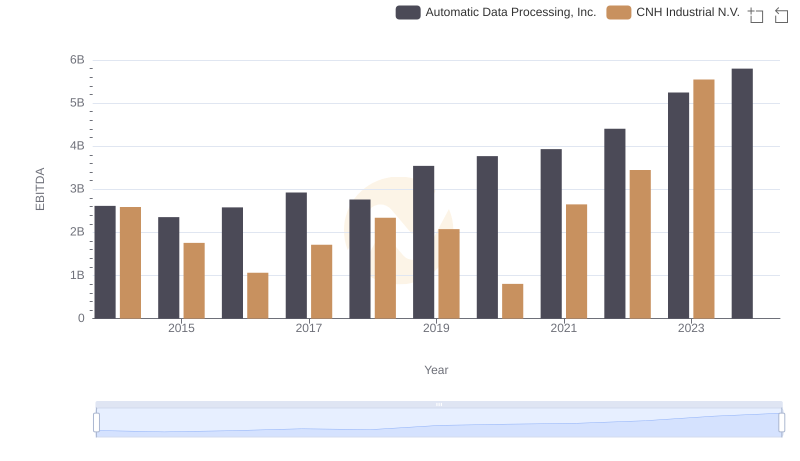
Automatic Data Processing, Inc. vs CNH Industrial N.V.: In-Depth EBITDA Performance Comparison
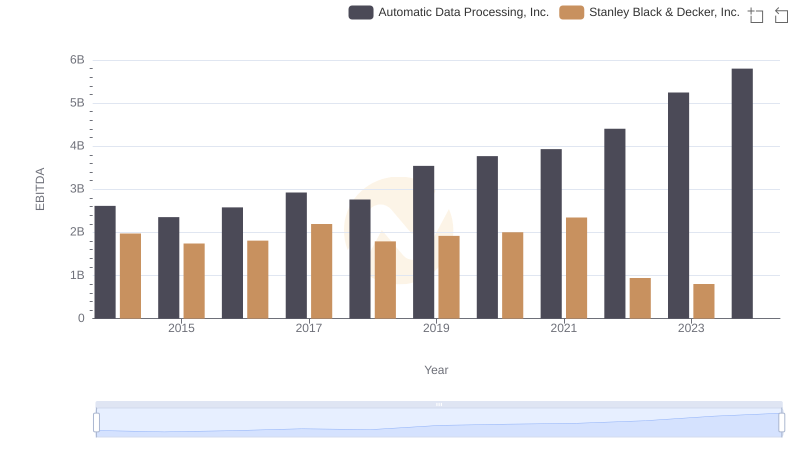
Automatic Data Processing, Inc. vs Stanley Black & Decker, Inc.: In-Depth EBITDA Performance Comparison
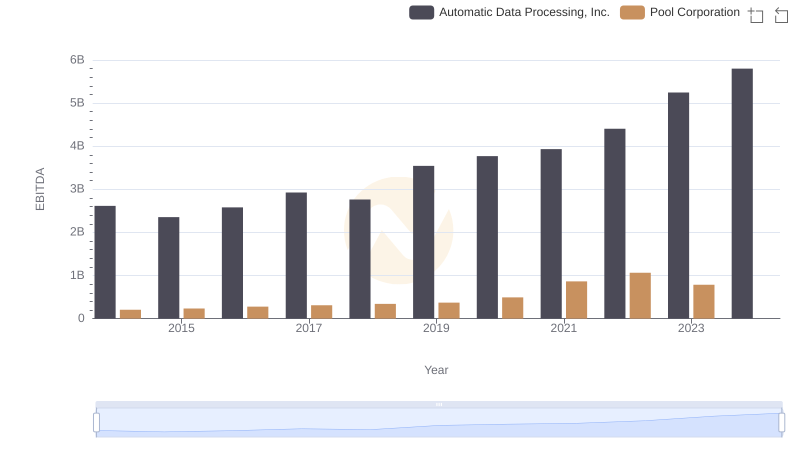
Professional EBITDA Benchmarking: Automatic Data Processing, Inc. vs Pool Corporation