| __timestamp | Automatic Data Processing, Inc. | CNH Industrial N.V. |
|---|---|---|
| Wednesday, January 1, 2014 | 2616900000 | 2591000000 |
| Thursday, January 1, 2015 | 2355100000 | 1757000000 |
| Friday, January 1, 2016 | 2579500000 | 1063000000 |
| Sunday, January 1, 2017 | 2927200000 | 1715000000 |
| Monday, January 1, 2018 | 2762900000 | 2339000000 |
| Tuesday, January 1, 2019 | 3544500000 | 2077000000 |
| Wednesday, January 1, 2020 | 3769700000 | 807000000 |
| Friday, January 1, 2021 | 3931600000 | 2650000000 |
| Saturday, January 1, 2022 | 4405500000 | 3447000000 |
| Sunday, January 1, 2023 | 5244600000 | 5549000000 |
| Monday, January 1, 2024 | 5800000000 |
Unlocking the unknown
In the ever-evolving landscape of global business, understanding the financial health of industry giants is crucial. Over the past decade, Automatic Data Processing, Inc. (ADP) and CNH Industrial N.V. have showcased intriguing EBITDA trends. From 2014 to 2023, ADP's EBITDA grew by approximately 122%, peaking at $5.24 billion in 2023. In contrast, CNH Industrial experienced a more volatile journey, with a remarkable 114% increase, reaching $5.55 billion in the same year. Notably, 2020 marked a challenging year for CNH, with EBITDA dropping to $807 million, highlighting the impact of global disruptions. As we look to 2024, ADP's continued growth is evident, while CNH's data remains elusive. This comparison underscores the resilience and adaptability of these corporations in navigating economic shifts.
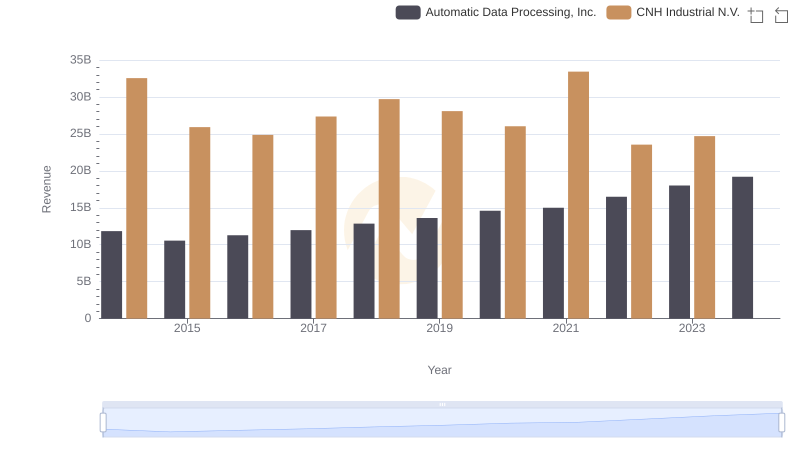
Automatic Data Processing, Inc. and CNH Industrial N.V.: A Comprehensive Revenue Analysis
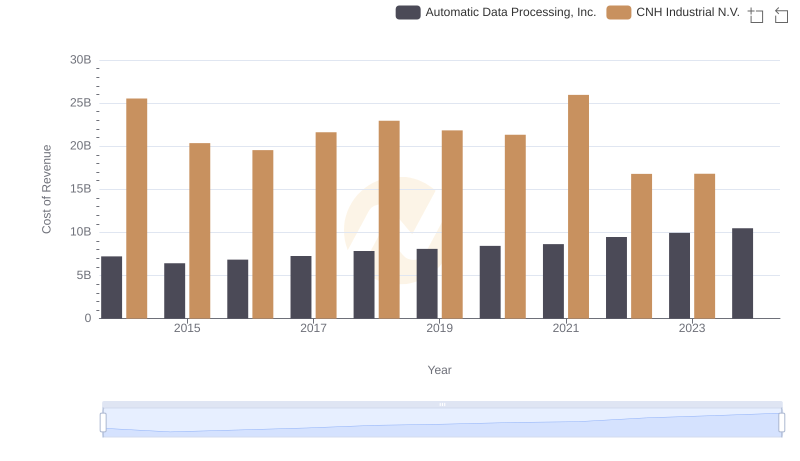
Automatic Data Processing, Inc. vs CNH Industrial N.V.: Efficiency in Cost of Revenue Explored
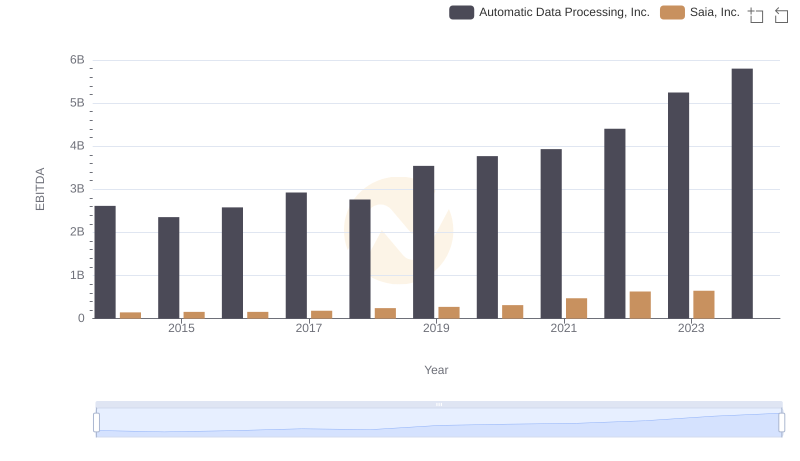
EBITDA Analysis: Evaluating Automatic Data Processing, Inc. Against Saia, Inc.
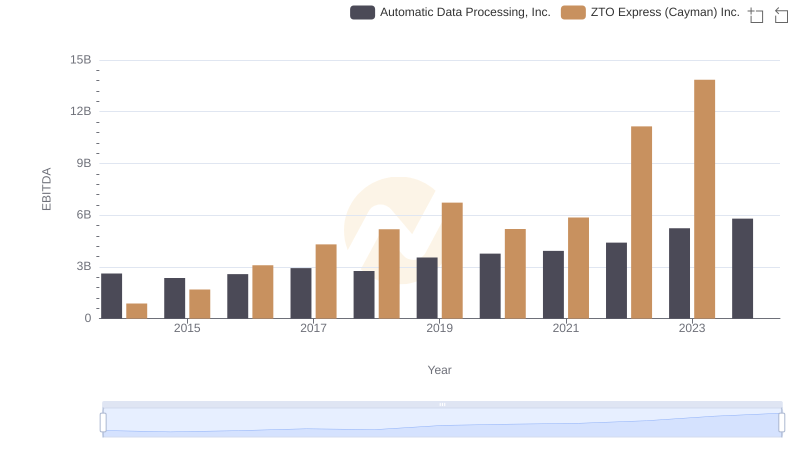
Automatic Data Processing, Inc. and ZTO Express (Cayman) Inc.: A Detailed Examination of EBITDA Performance
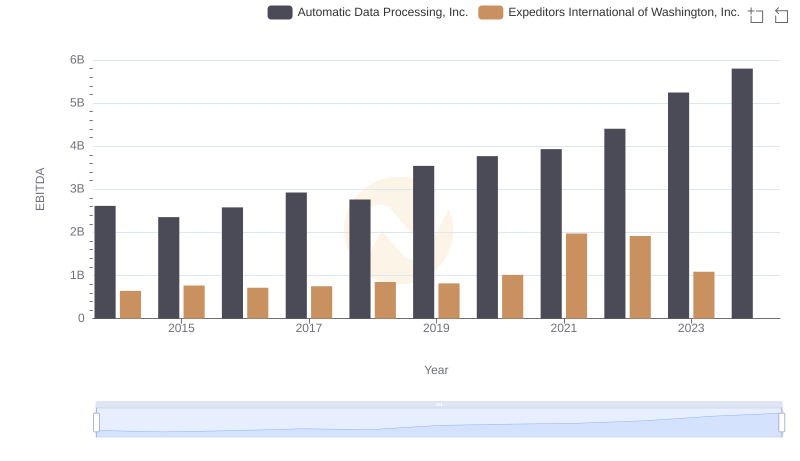
Professional EBITDA Benchmarking: Automatic Data Processing, Inc. vs Expeditors International of Washington, Inc.

A Professional Review of EBITDA: Automatic Data Processing, Inc. Compared to Graco Inc.
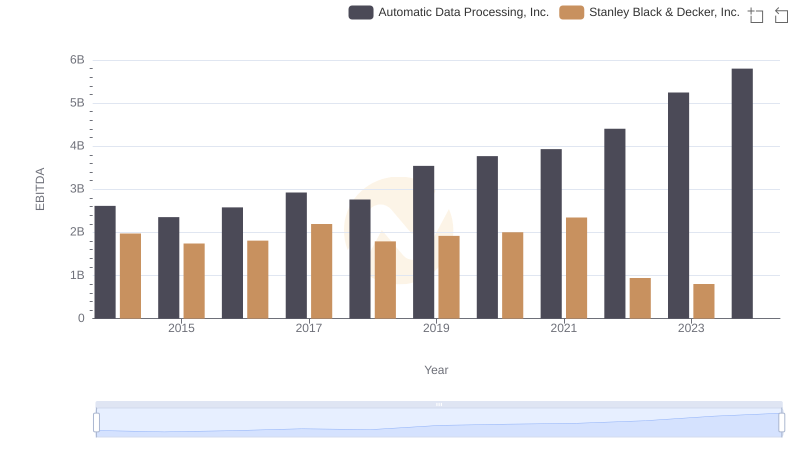
Automatic Data Processing, Inc. vs Stanley Black & Decker, Inc.: In-Depth EBITDA Performance Comparison
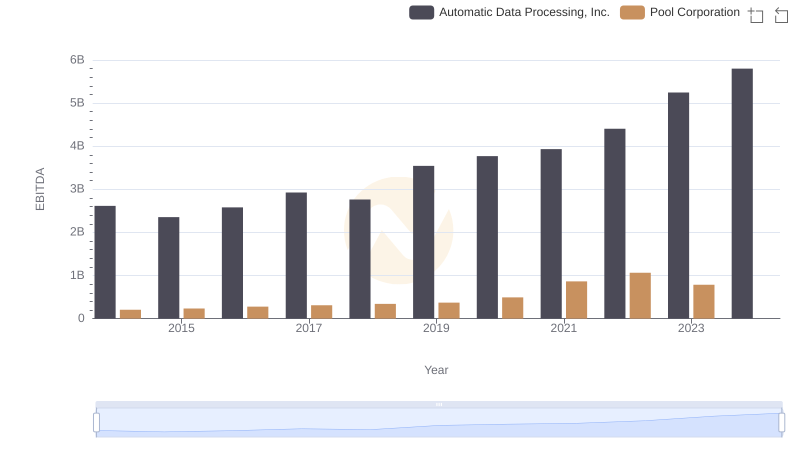
Professional EBITDA Benchmarking: Automatic Data Processing, Inc. vs Pool Corporation
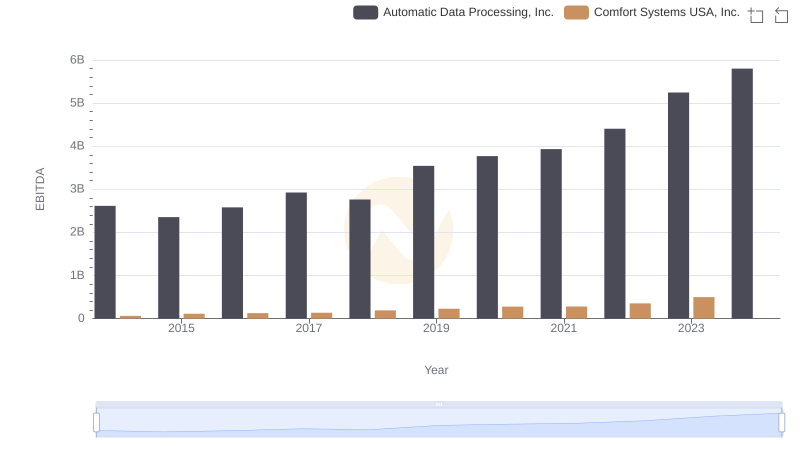
EBITDA Analysis: Evaluating Automatic Data Processing, Inc. Against Comfort Systems USA, Inc.