| __timestamp | Automatic Data Processing, Inc. | Saia, Inc. |
|---|---|---|
| Wednesday, January 1, 2014 | 4611400000 | 159268000 |
| Thursday, January 1, 2015 | 4133200000 | 154120000 |
| Friday, January 1, 2016 | 4450200000 | 159502000 |
| Sunday, January 1, 2017 | 4712600000 | 175046000 |
| Monday, January 1, 2018 | 5016700000 | 230070000 |
| Tuesday, January 1, 2019 | 5526700000 | 249653000 |
| Wednesday, January 1, 2020 | 6144700000 | 283848000 |
| Friday, January 1, 2021 | 6365100000 | 451687000 |
| Saturday, January 1, 2022 | 7036400000 | 590963000 |
| Sunday, January 1, 2023 | 8058800000 | 598932000 |
| Monday, January 1, 2024 | 8725900000 |
In pursuit of knowledge
In the ever-evolving landscape of corporate finance, understanding the trajectory of a company's gross profit is crucial. Over the past decade, Automatic Data Processing, Inc. (ADP) and Saia, Inc. have showcased distinct financial journeys. ADP, a titan in the human resources sector, has seen its gross profit soar by approximately 89% from 2014 to 2023, reflecting its robust market position and strategic growth initiatives. In contrast, Saia, Inc., a key player in the transportation industry, experienced a remarkable 276% increase in gross profit over the same period, highlighting its dynamic expansion and operational efficiency.
While ADP's growth is steady and substantial, Saia's trajectory is a testament to its aggressive market strategies. However, data for 2024 remains elusive, leaving room for speculation on future trends. This analysis underscores the diverse paths companies can take in achieving financial success.

Automatic Data Processing, Inc. vs Saia, Inc.: Annual Revenue Growth Compared
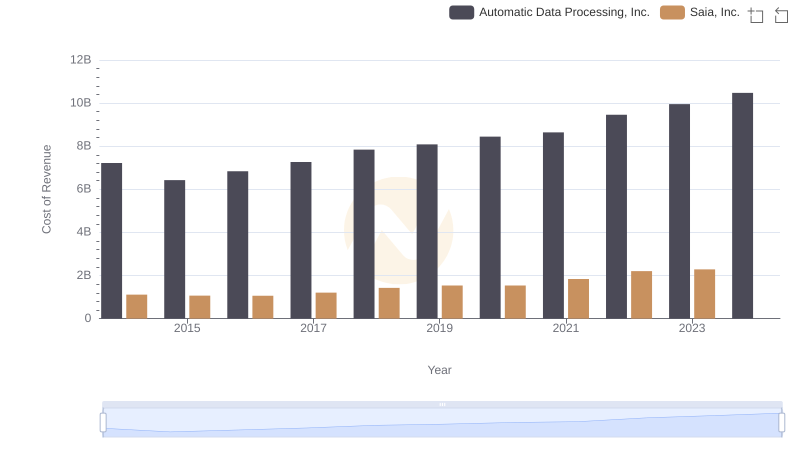
Cost Insights: Breaking Down Automatic Data Processing, Inc. and Saia, Inc.'s Expenses

Gross Profit Trends Compared: Automatic Data Processing, Inc. vs ZTO Express (Cayman) Inc.
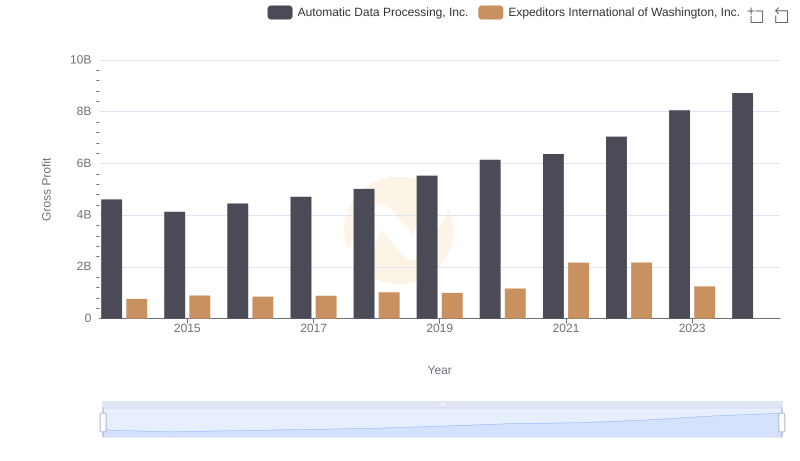
Gross Profit Comparison: Automatic Data Processing, Inc. and Expeditors International of Washington, Inc. Trends

Key Insights on Gross Profit: Automatic Data Processing, Inc. vs AECOM
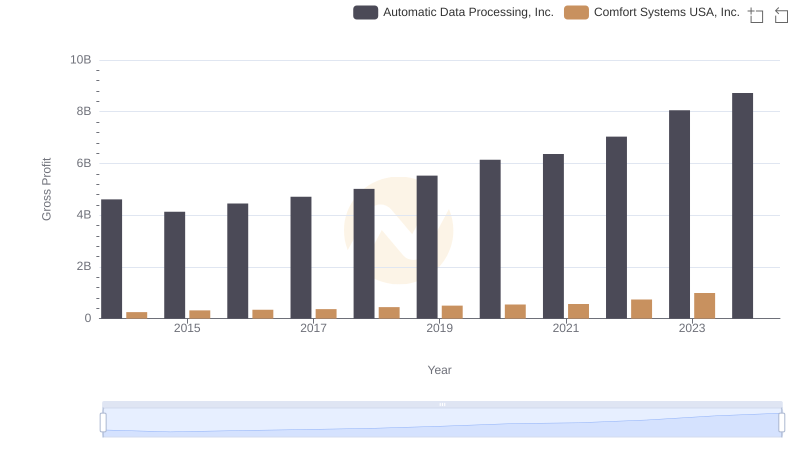
Gross Profit Comparison: Automatic Data Processing, Inc. and Comfort Systems USA, Inc. Trends
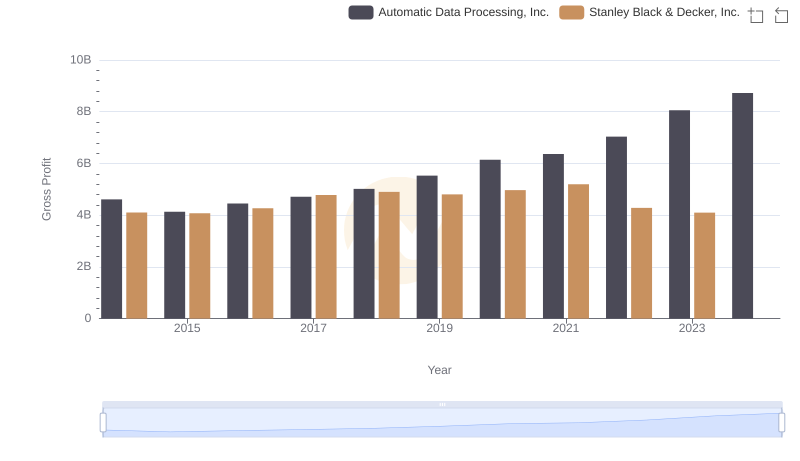
Key Insights on Gross Profit: Automatic Data Processing, Inc. vs Stanley Black & Decker, Inc.
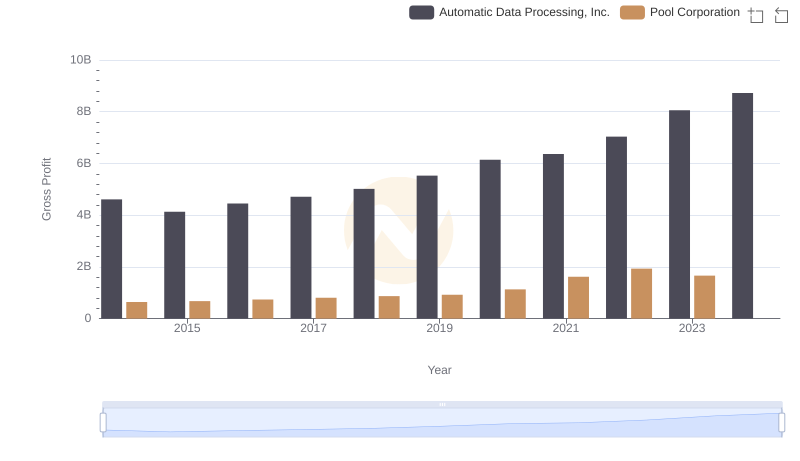
Gross Profit Comparison: Automatic Data Processing, Inc. and Pool Corporation Trends

Selling, General, and Administrative Costs: Automatic Data Processing, Inc. vs Saia, Inc.
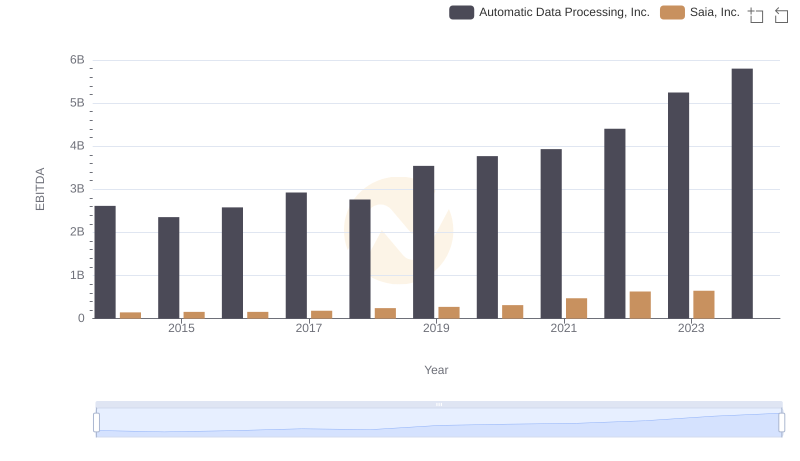
EBITDA Analysis: Evaluating Automatic Data Processing, Inc. Against Saia, Inc.