| __timestamp | ITT Inc. | Waste Connections, Inc. |
|---|---|---|
| Wednesday, January 1, 2014 | 2654600000 | 2079166000 |
| Thursday, January 1, 2015 | 2485600000 | 2117287000 |
| Friday, January 1, 2016 | 2405400000 | 3375863000 |
| Sunday, January 1, 2017 | 2585300000 | 4630488000 |
| Monday, January 1, 2018 | 2745100000 | 4922941000 |
| Tuesday, January 1, 2019 | 2846400000 | 5388679000 |
| Wednesday, January 1, 2020 | 2477800000 | 5445990000 |
| Friday, January 1, 2021 | 2765000000 | 6151361000 |
| Saturday, January 1, 2022 | 2987700000 | 7211859000 |
| Sunday, January 1, 2023 | 3283000000 | 8021951000 |
| Monday, January 1, 2024 | 3630700000 | 8919591000 |
Data in motion
In the ever-evolving landscape of industrial services, Waste Connections, Inc. and ITT Inc. have emerged as formidable players. Over the past decade, Waste Connections has demonstrated a remarkable revenue growth trajectory, surging by approximately 286% from 2014 to 2023. This growth is a testament to their strategic acquisitions and expanding footprint in the waste management sector. In contrast, ITT Inc., a leader in engineering and manufacturing, has shown a steady revenue increase of about 24% over the same period, reflecting its resilience and adaptability in a competitive market.
By 2023, Waste Connections' revenue reached nearly double that of ITT Inc., highlighting its dominant position. This comparison not only underscores the dynamic nature of these industries but also offers insights into the strategic maneuvers that have propelled these companies forward. As we look to the future, the question remains: how will these giants continue to innovate and grow?
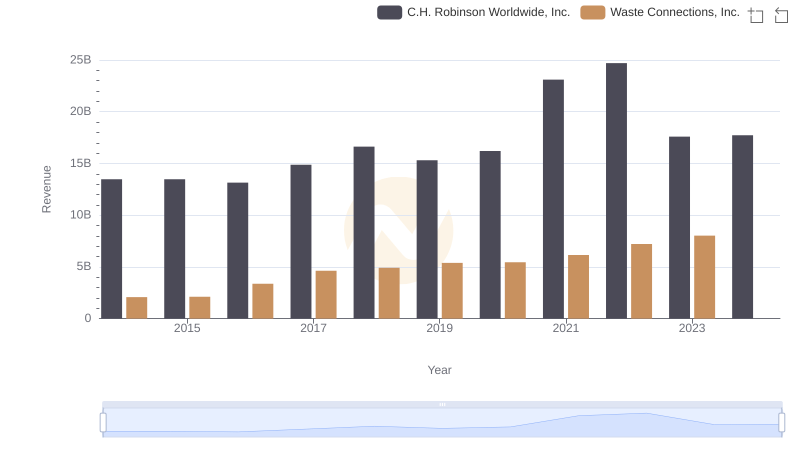
Revenue Insights: Waste Connections, Inc. and C.H. Robinson Worldwide, Inc. Performance Compared
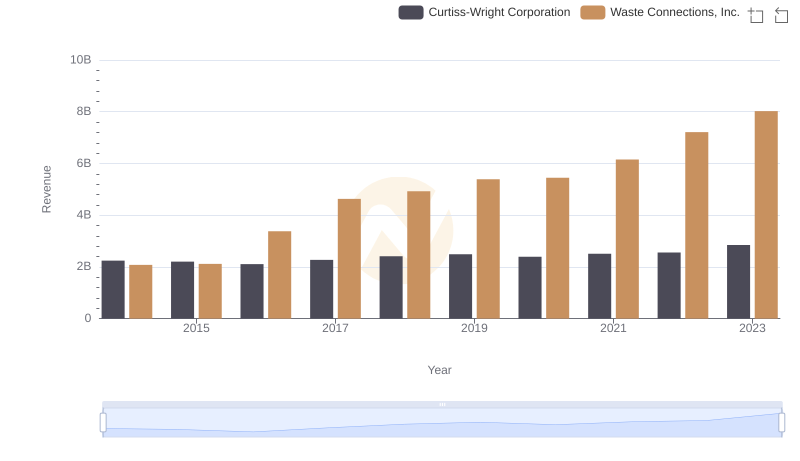
Annual Revenue Comparison: Waste Connections, Inc. vs Curtiss-Wright Corporation
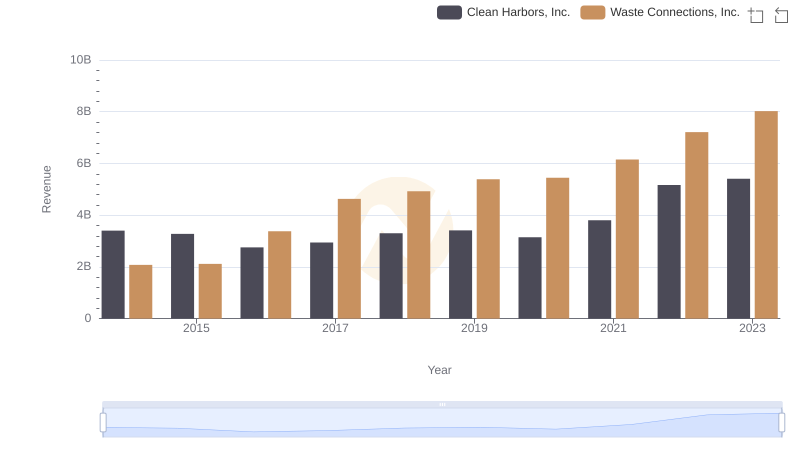
Waste Connections, Inc. or Clean Harbors, Inc.: Who Leads in Yearly Revenue?
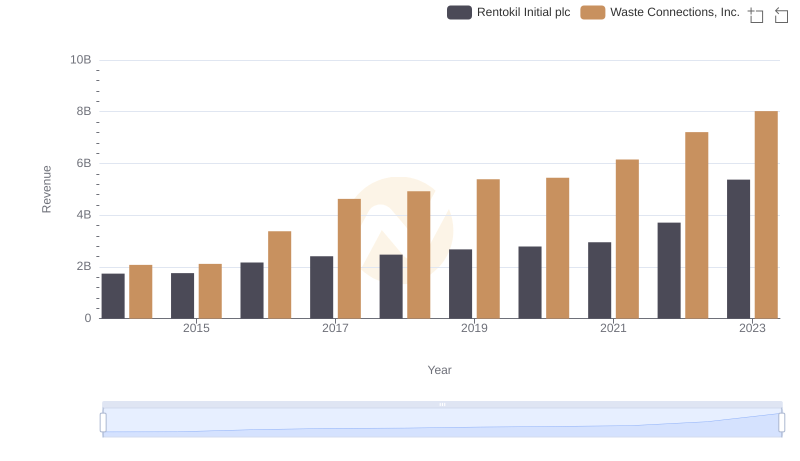
Revenue Insights: Waste Connections, Inc. and Rentokil Initial plc Performance Compared
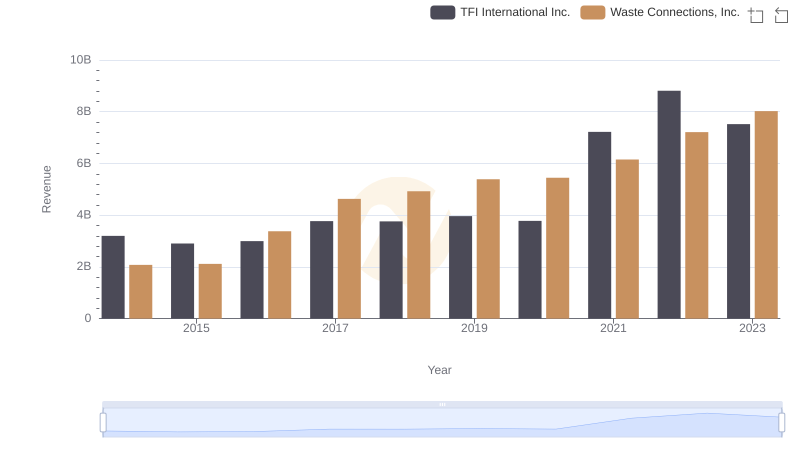
Waste Connections, Inc. or TFI International Inc.: Who Leads in Yearly Revenue?
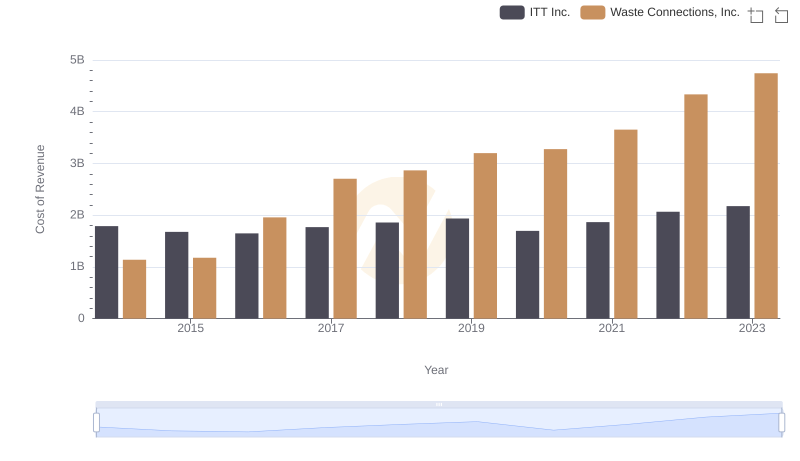
Cost of Revenue Trends: Waste Connections, Inc. vs ITT Inc.
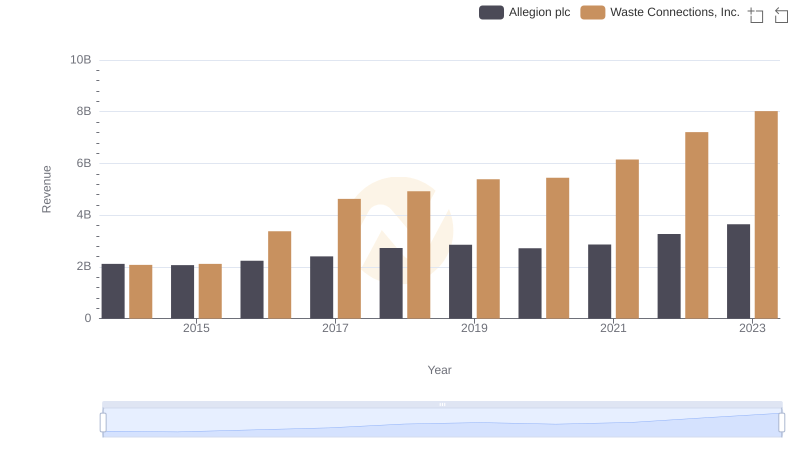
Revenue Showdown: Waste Connections, Inc. vs Allegion plc
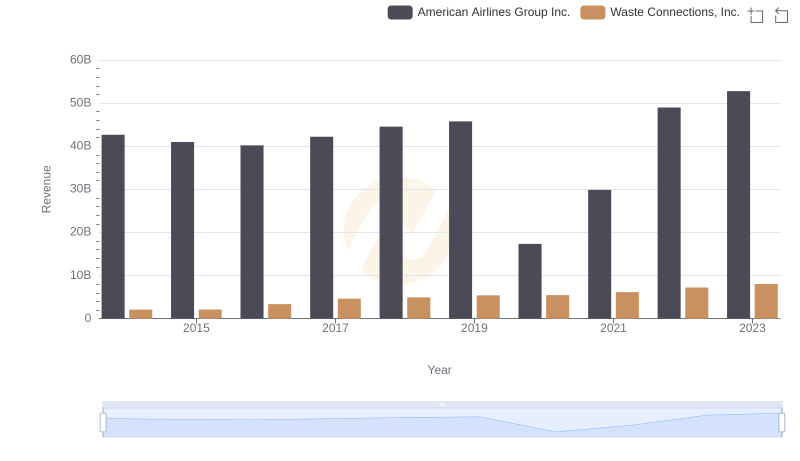
Revenue Insights: Waste Connections, Inc. and American Airlines Group Inc. Performance Compared
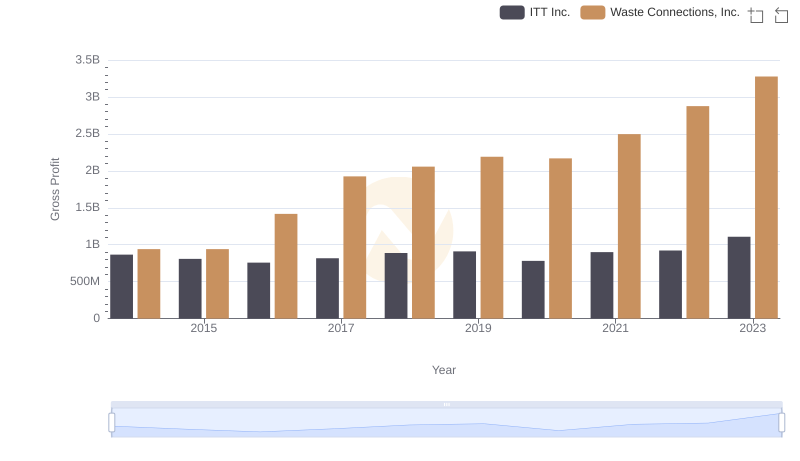
Waste Connections, Inc. vs ITT Inc.: A Gross Profit Performance Breakdown
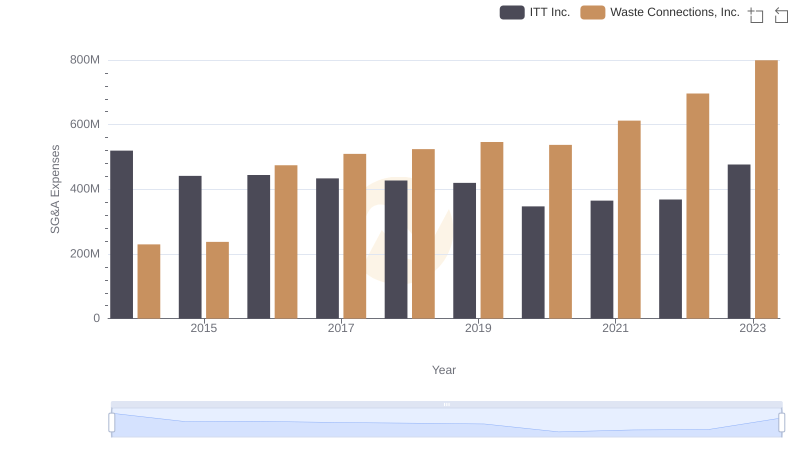
Cost Management Insights: SG&A Expenses for Waste Connections, Inc. and ITT Inc.
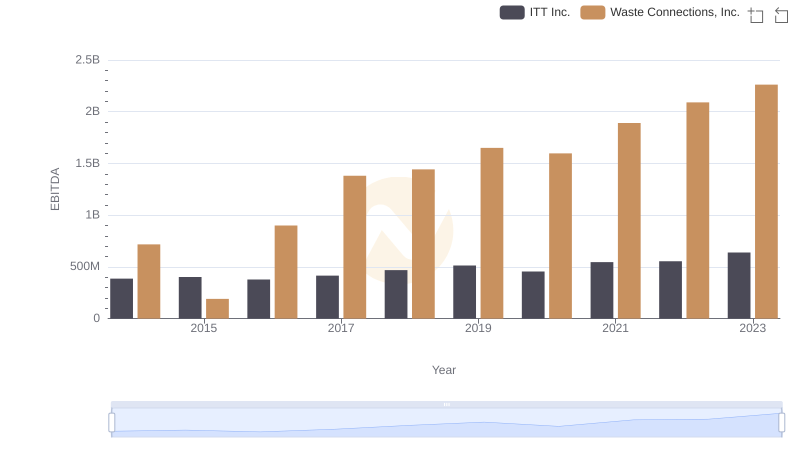
Comprehensive EBITDA Comparison: Waste Connections, Inc. vs ITT Inc.