| __timestamp | Booz Allen Hamilton Holding Corporation | Trane Technologies plc |
|---|---|---|
| Wednesday, January 1, 2014 | 2716113000 | 8982800000 |
| Thursday, January 1, 2015 | 2593849000 | 9301600000 |
| Friday, January 1, 2016 | 2580026000 | 9329300000 |
| Sunday, January 1, 2017 | 2691982000 | 9811600000 |
| Monday, January 1, 2018 | 2867103000 | 10847600000 |
| Tuesday, January 1, 2019 | 3100466000 | 11451500000 |
| Wednesday, January 1, 2020 | 3379180000 | 8651300000 |
| Friday, January 1, 2021 | 3657530000 | 9666800000 |
| Saturday, January 1, 2022 | 3899622000 | 11026900000 |
| Sunday, January 1, 2023 | 4304810000 | 11820400000 |
| Monday, January 1, 2024 | 8202847000 | 12757700000 |
Unveiling the hidden dimensions of data
In the ever-evolving landscape of corporate finance, understanding cost structures is crucial. This analysis delves into the cost of revenue trends for Trane Technologies plc and Booz Allen Hamilton Holding Corporation from 2014 to 2023. Over this decade, Trane Technologies consistently maintained a higher cost of revenue, peaking at approximately $11.8 billion in 2023, reflecting its expansive operations in the industrial sector. In contrast, Booz Allen Hamilton, a leader in management consulting, saw a significant rise in its cost of revenue, culminating in a dramatic 90% increase from 2014 to 2024. This surge underscores the company's strategic expansion and increased project engagements. Notably, 2024 data for Trane Technologies is missing, highlighting potential data gaps. These insights offer a window into the financial strategies and market dynamics influencing these industry giants.
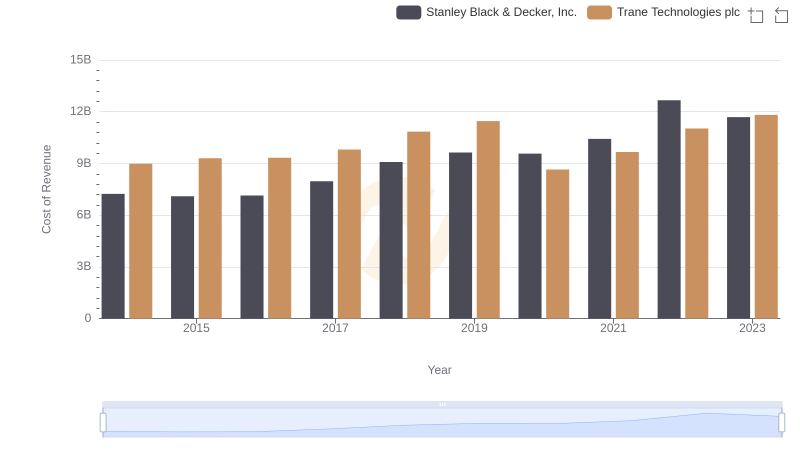
Cost of Revenue Trends: Trane Technologies plc vs Stanley Black & Decker, Inc.
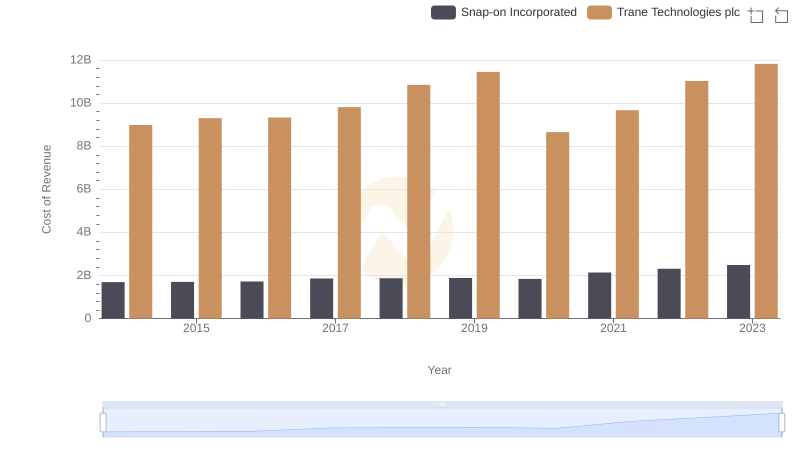
Cost Insights: Breaking Down Trane Technologies plc and Snap-on Incorporated's Expenses
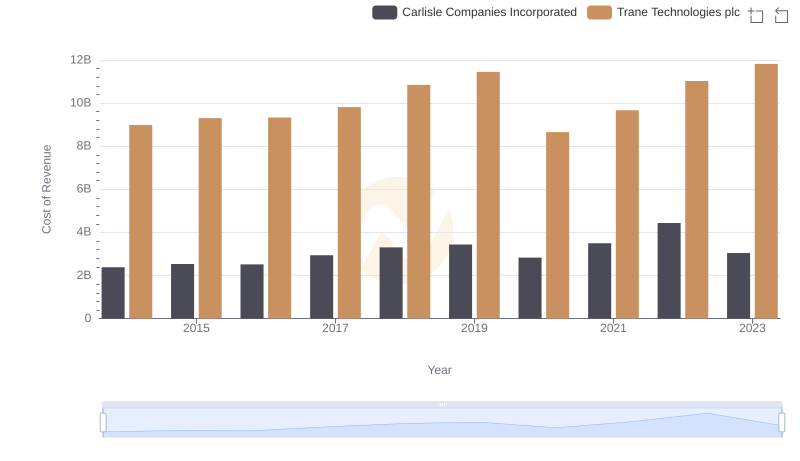
Comparing Cost of Revenue Efficiency: Trane Technologies plc vs Carlisle Companies Incorporated
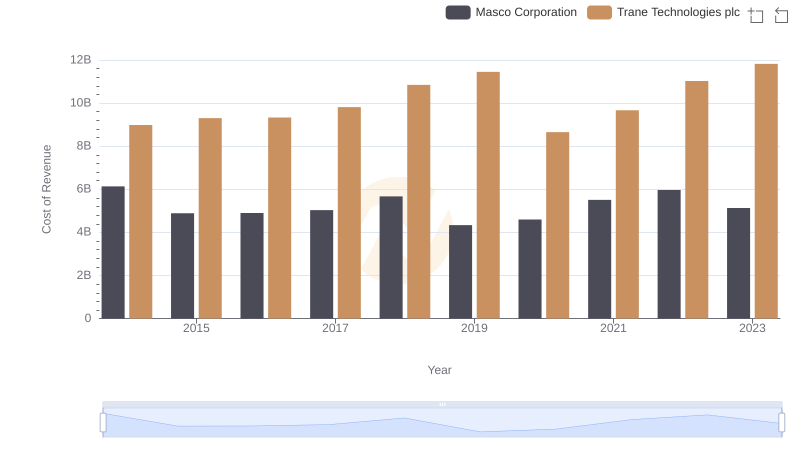
Cost of Revenue Trends: Trane Technologies plc vs Masco Corporation
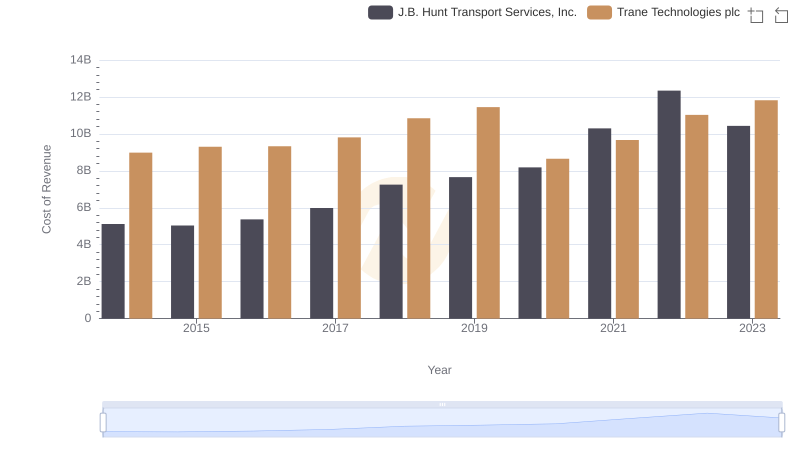
Trane Technologies plc vs J.B. Hunt Transport Services, Inc.: Efficiency in Cost of Revenue Explored
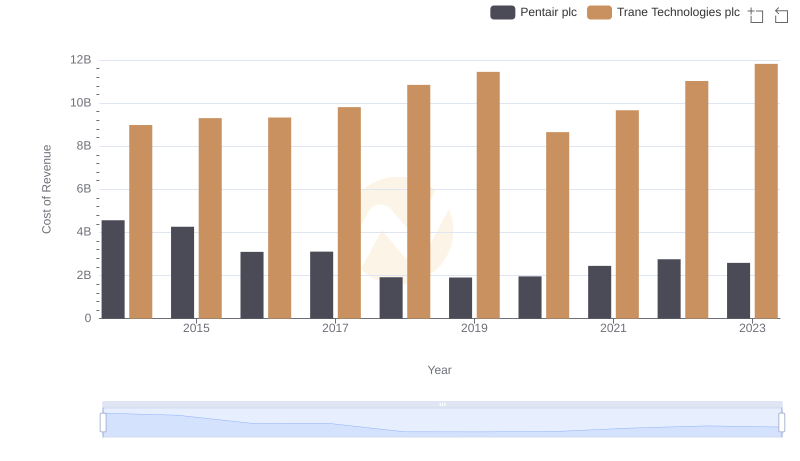
Analyzing Cost of Revenue: Trane Technologies plc and Pentair plc
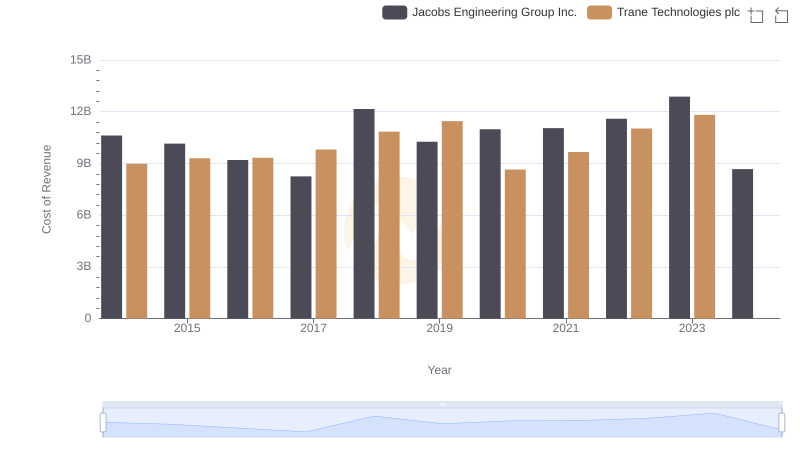
Comparing Cost of Revenue Efficiency: Trane Technologies plc vs Jacobs Engineering Group Inc.
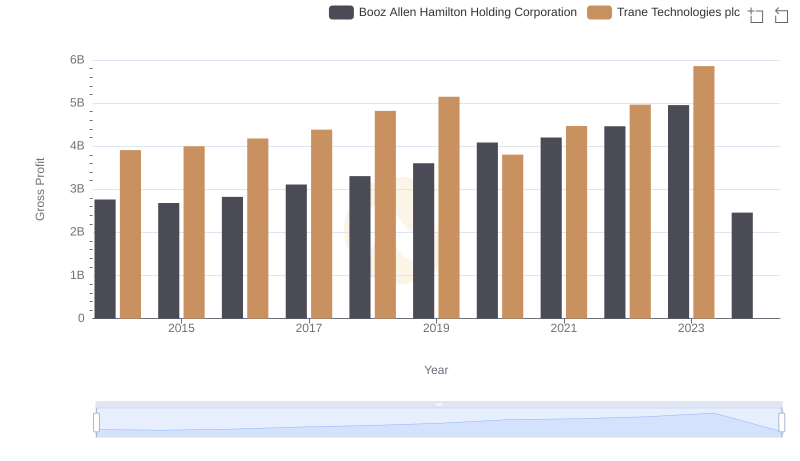
Key Insights on Gross Profit: Trane Technologies plc vs Booz Allen Hamilton Holding Corporation
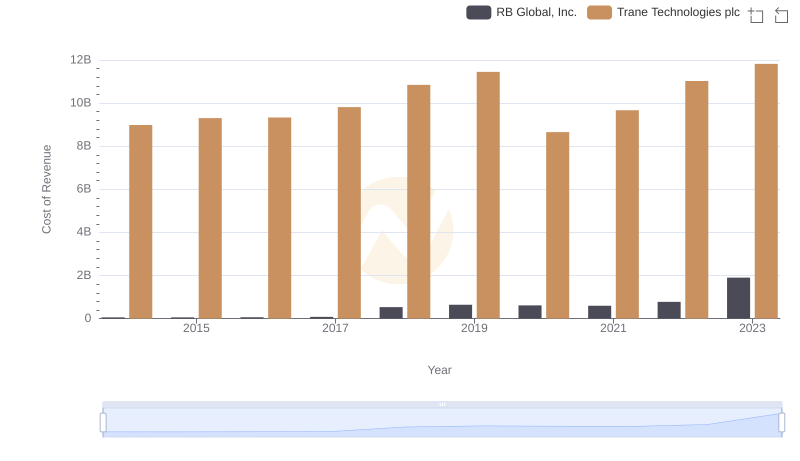
Cost Insights: Breaking Down Trane Technologies plc and RB Global, Inc.'s Expenses
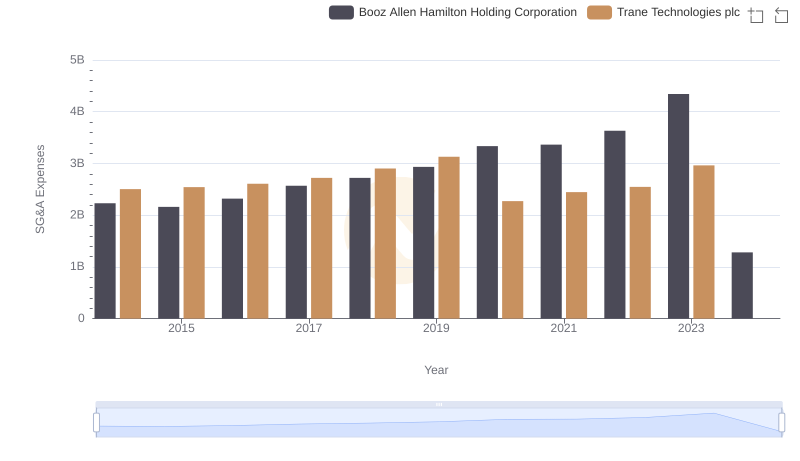
Trane Technologies plc and Booz Allen Hamilton Holding Corporation: SG&A Spending Patterns Compared

Professional EBITDA Benchmarking: Trane Technologies plc vs Booz Allen Hamilton Holding Corporation