| __timestamp | Carlisle Companies Incorporated | Trane Technologies plc |
|---|---|---|
| Wednesday, January 1, 2014 | 2384500000 | 8982800000 |
| Thursday, January 1, 2015 | 2536500000 | 9301600000 |
| Friday, January 1, 2016 | 2518100000 | 9329300000 |
| Sunday, January 1, 2017 | 2941900000 | 9811600000 |
| Monday, January 1, 2018 | 3304800000 | 10847600000 |
| Tuesday, January 1, 2019 | 3439900000 | 11451500000 |
| Wednesday, January 1, 2020 | 2832500000 | 8651300000 |
| Friday, January 1, 2021 | 3495600000 | 9666800000 |
| Saturday, January 1, 2022 | 4434500000 | 11026900000 |
| Sunday, January 1, 2023 | 3042900000 | 11820400000 |
| Monday, January 1, 2024 | 3115900000 | 12757700000 |
In pursuit of knowledge
In the competitive landscape of industrial manufacturing, cost efficiency is a critical metric. Over the past decade, Trane Technologies plc and Carlisle Companies Incorporated have demonstrated contrasting trajectories in their cost of revenue. From 2014 to 2023, Trane Technologies consistently maintained a higher cost of revenue, peaking at approximately $11.8 billion in 2023. This represents a 31% increase from 2014, reflecting their expansive operations and market reach.
Conversely, Carlisle Companies showed a more fluctuating pattern, with a notable peak in 2022 at around $4.4 billion, a 86% rise from 2014. However, by 2023, their cost of revenue decreased to $3 billion, indicating strategic cost management or market adjustments. This comparison highlights the dynamic nature of cost efficiency strategies in the industrial sector, offering valuable insights for investors and industry analysts alike.
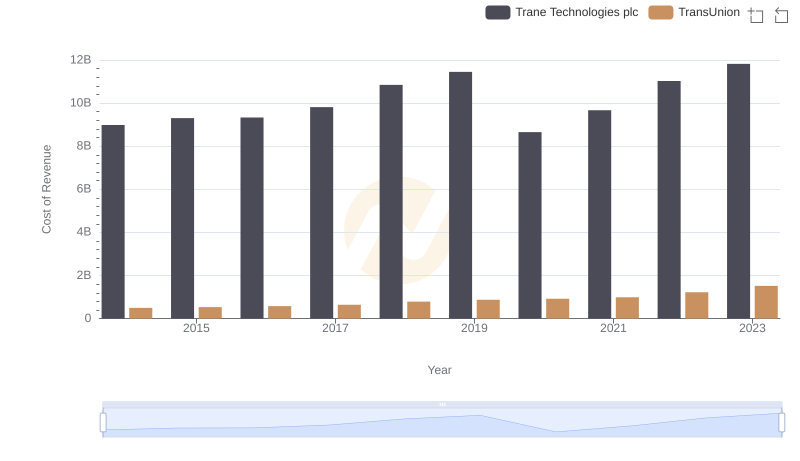
Cost of Revenue Comparison: Trane Technologies plc vs TransUnion
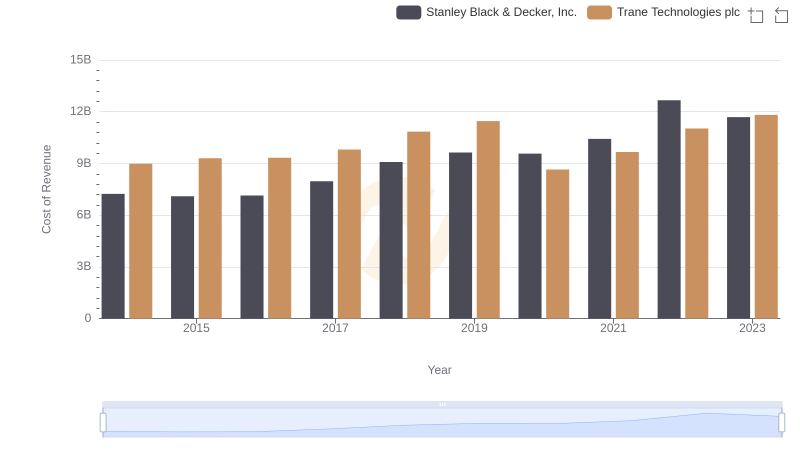
Cost of Revenue Trends: Trane Technologies plc vs Stanley Black & Decker, Inc.
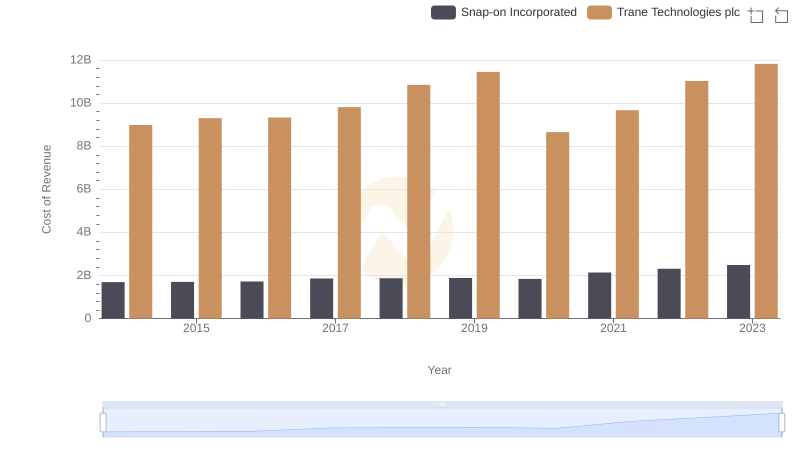
Cost Insights: Breaking Down Trane Technologies plc and Snap-on Incorporated's Expenses
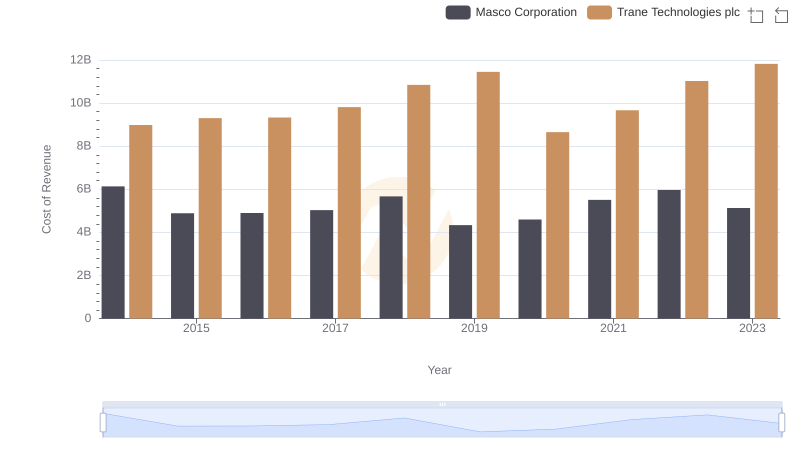
Cost of Revenue Trends: Trane Technologies plc vs Masco Corporation
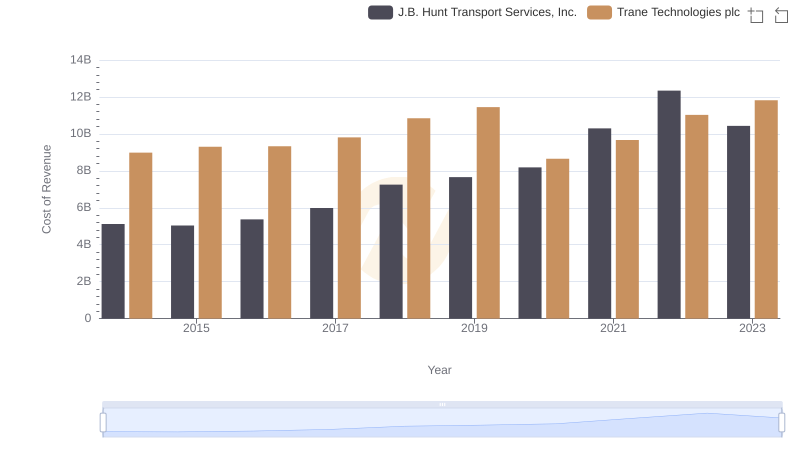
Trane Technologies plc vs J.B. Hunt Transport Services, Inc.: Efficiency in Cost of Revenue Explored
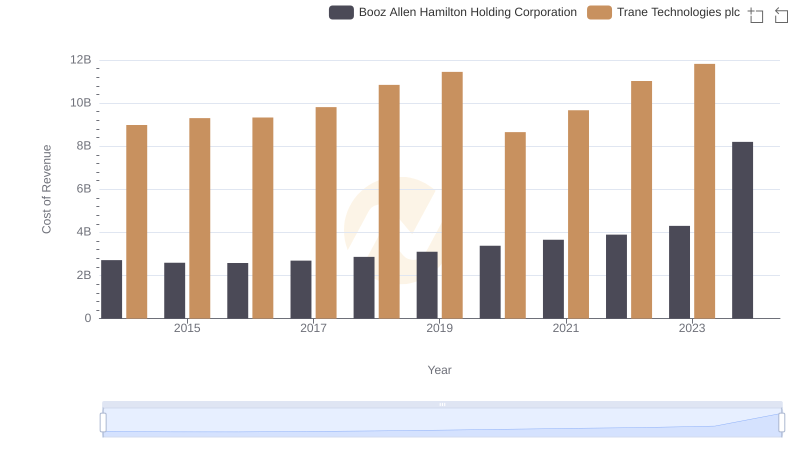
Cost of Revenue Trends: Trane Technologies plc vs Booz Allen Hamilton Holding Corporation
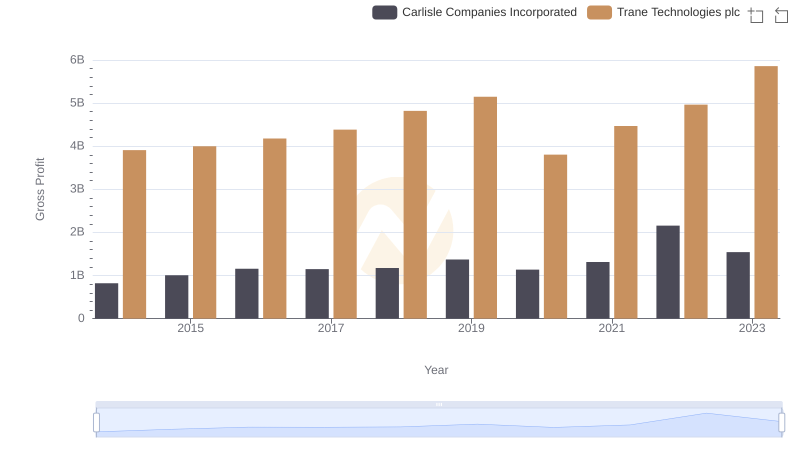
Key Insights on Gross Profit: Trane Technologies plc vs Carlisle Companies Incorporated
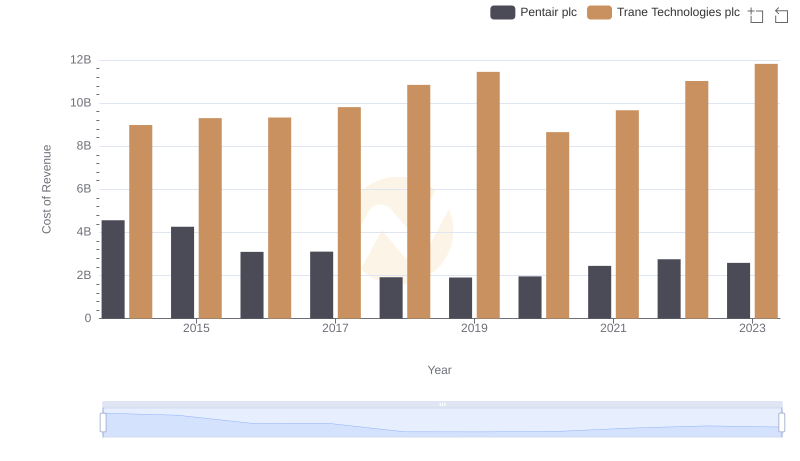
Analyzing Cost of Revenue: Trane Technologies plc and Pentair plc
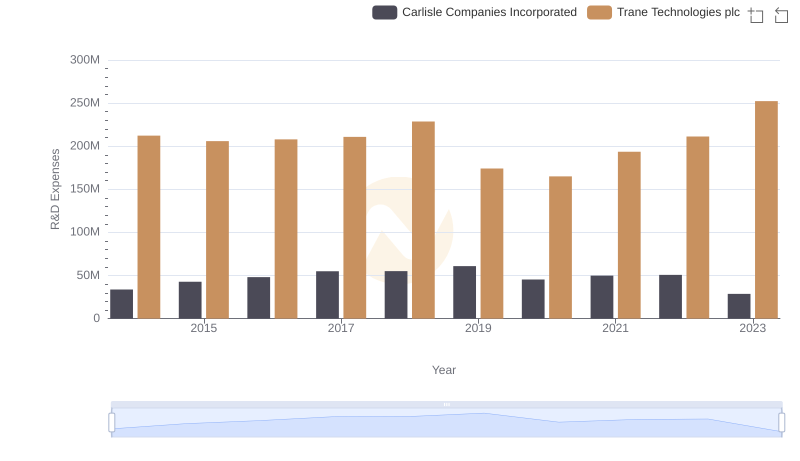
Trane Technologies plc vs Carlisle Companies Incorporated: Strategic Focus on R&D Spending
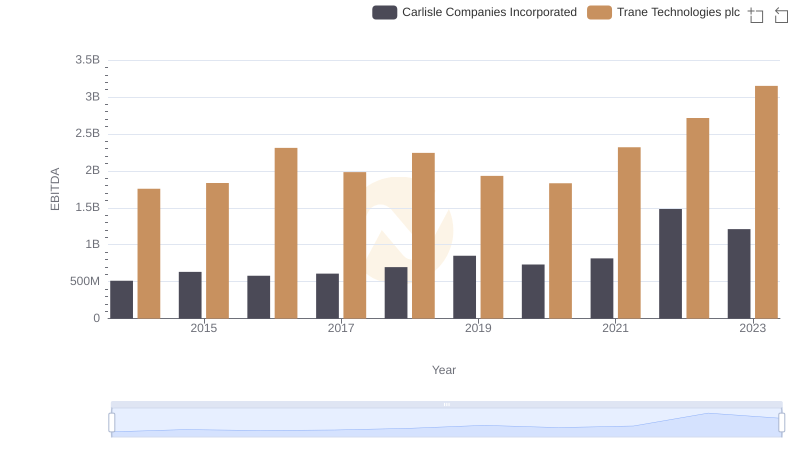
A Professional Review of EBITDA: Trane Technologies plc Compared to Carlisle Companies Incorporated