| __timestamp | Pentair plc | Trane Technologies plc |
|---|---|---|
| Wednesday, January 1, 2014 | 4563000000 | 8982800000 |
| Thursday, January 1, 2015 | 4263200000 | 9301600000 |
| Friday, January 1, 2016 | 3095900000 | 9329300000 |
| Sunday, January 1, 2017 | 3107400000 | 9811600000 |
| Monday, January 1, 2018 | 1917400000 | 10847600000 |
| Tuesday, January 1, 2019 | 1905700000 | 11451500000 |
| Wednesday, January 1, 2020 | 1960200000 | 8651300000 |
| Friday, January 1, 2021 | 2445600000 | 9666800000 |
| Saturday, January 1, 2022 | 2757200000 | 11026900000 |
| Sunday, January 1, 2023 | 2585300000 | 11820400000 |
| Monday, January 1, 2024 | 2484000000 | 12757700000 |
Unleashing insights
In the ever-evolving landscape of industrial technology, understanding the cost dynamics is crucial. Trane Technologies plc and Pentair plc, two giants in the sector, have shown intriguing trends in their cost of revenue over the past decade. From 2014 to 2023, Trane Technologies consistently outpaced Pentair, with its cost of revenue peaking at approximately 11.8 billion in 2023, marking a 32% increase from 2014. In contrast, Pentair's cost of revenue saw a significant decline, dropping by nearly 43% from its 2014 peak of 4.6 billion to 2.6 billion in 2023. This divergence highlights Trane's aggressive growth strategy and Pentair's focus on cost efficiency. As the industry continues to adapt to global challenges, these trends offer valuable insights into the strategic priorities of these leading companies.
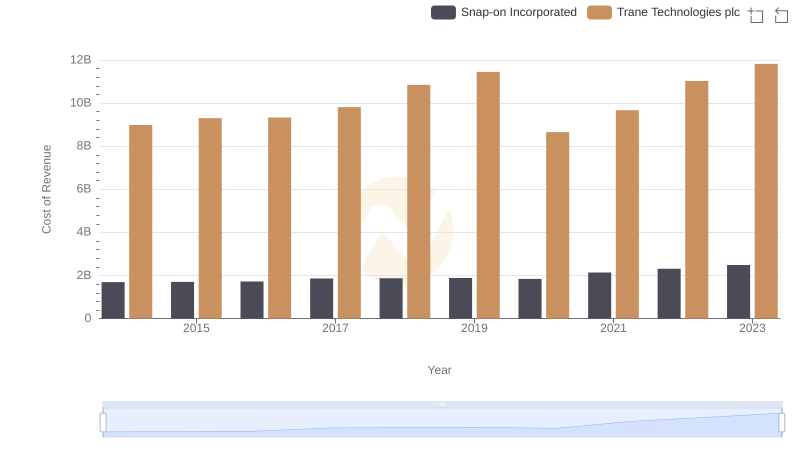
Cost Insights: Breaking Down Trane Technologies plc and Snap-on Incorporated's Expenses
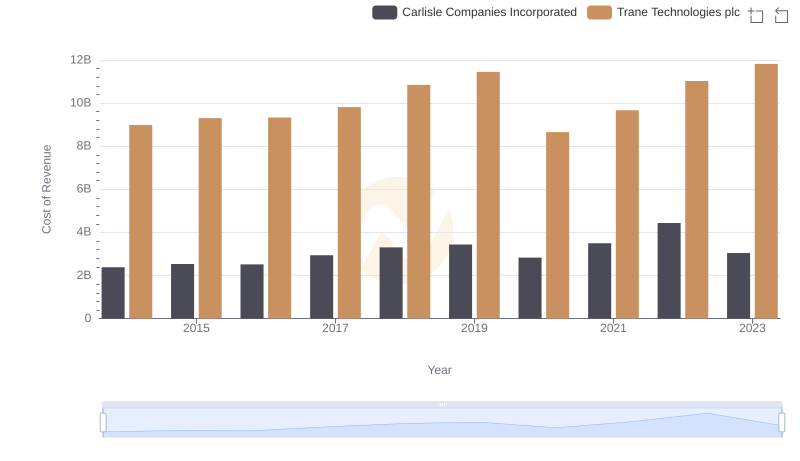
Comparing Cost of Revenue Efficiency: Trane Technologies plc vs Carlisle Companies Incorporated
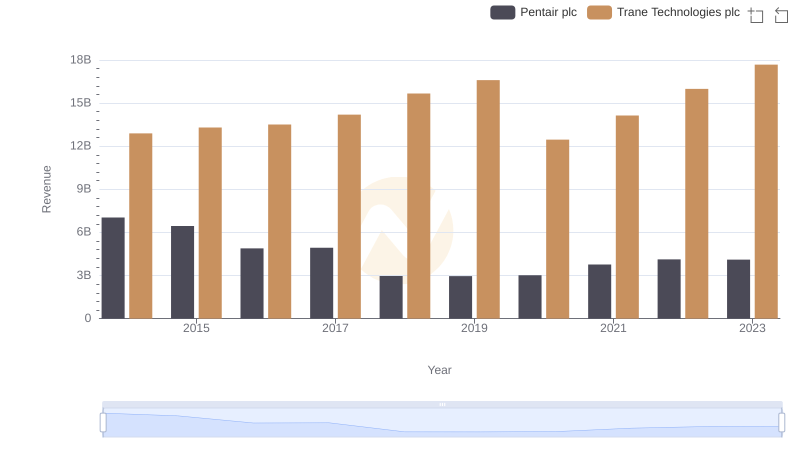
Trane Technologies plc vs Pentair plc: Examining Key Revenue Metrics
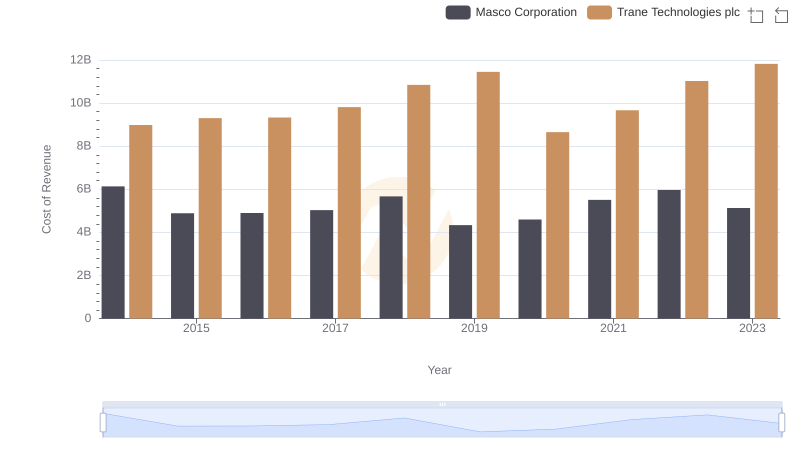
Cost of Revenue Trends: Trane Technologies plc vs Masco Corporation
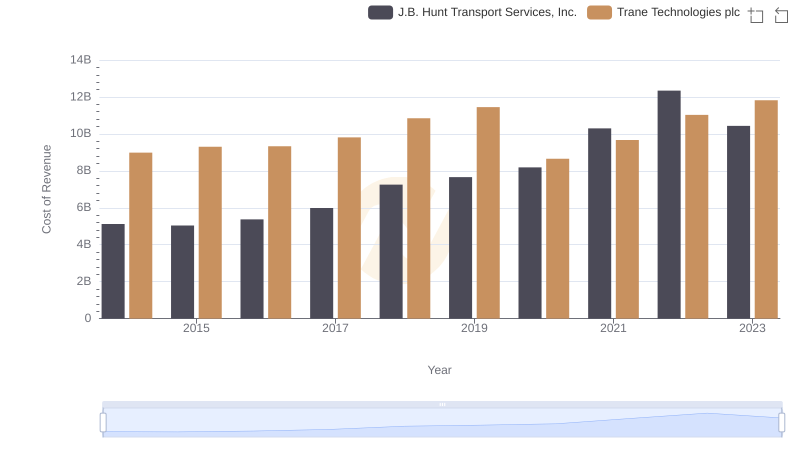
Trane Technologies plc vs J.B. Hunt Transport Services, Inc.: Efficiency in Cost of Revenue Explored
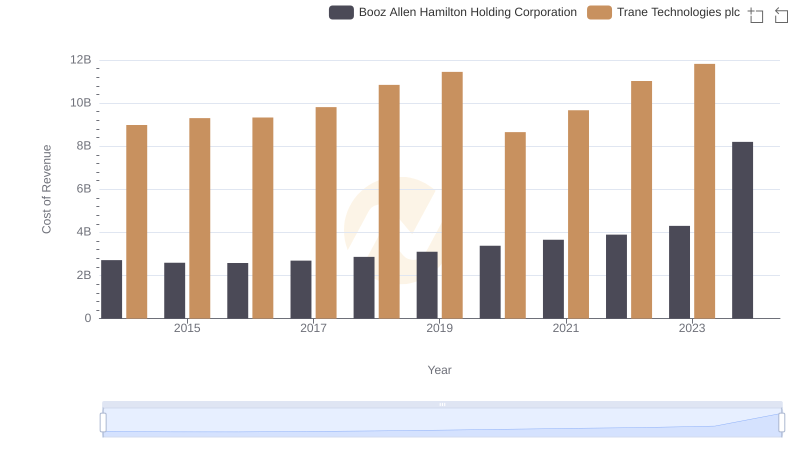
Cost of Revenue Trends: Trane Technologies plc vs Booz Allen Hamilton Holding Corporation
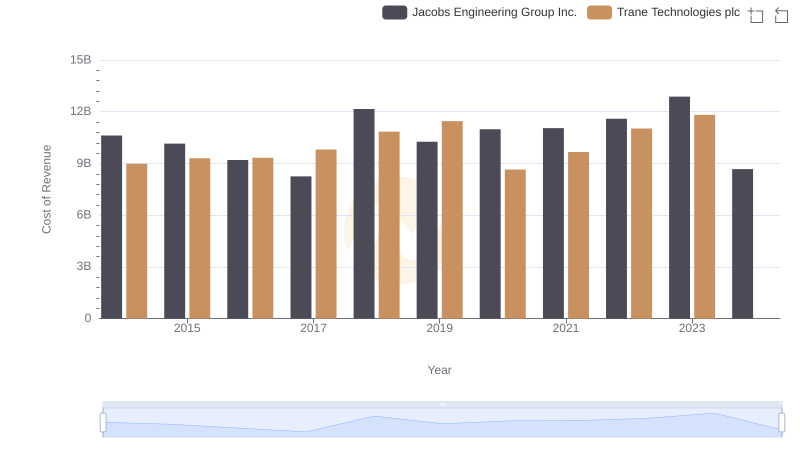
Comparing Cost of Revenue Efficiency: Trane Technologies plc vs Jacobs Engineering Group Inc.
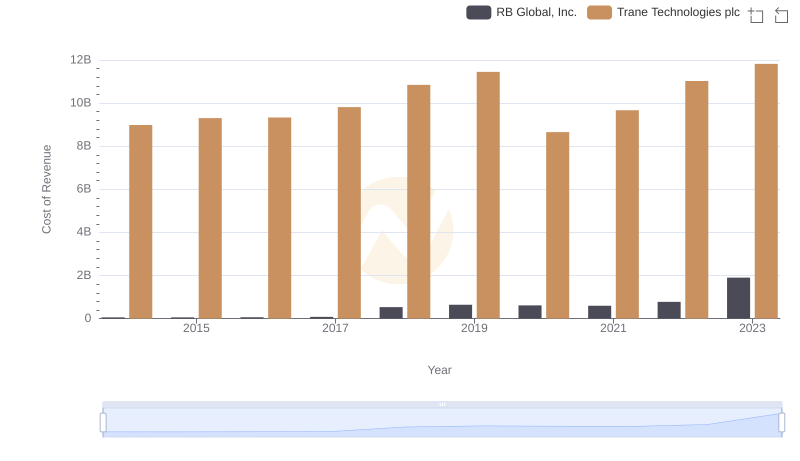
Cost Insights: Breaking Down Trane Technologies plc and RB Global, Inc.'s Expenses
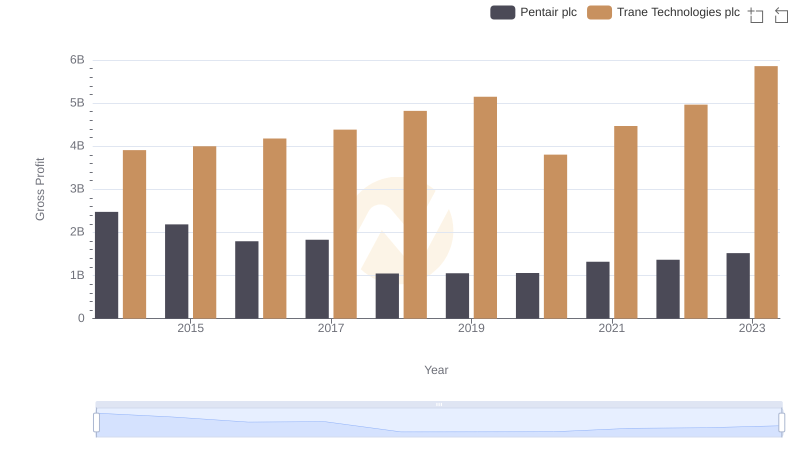
Trane Technologies plc and Pentair plc: A Detailed Gross Profit Analysis
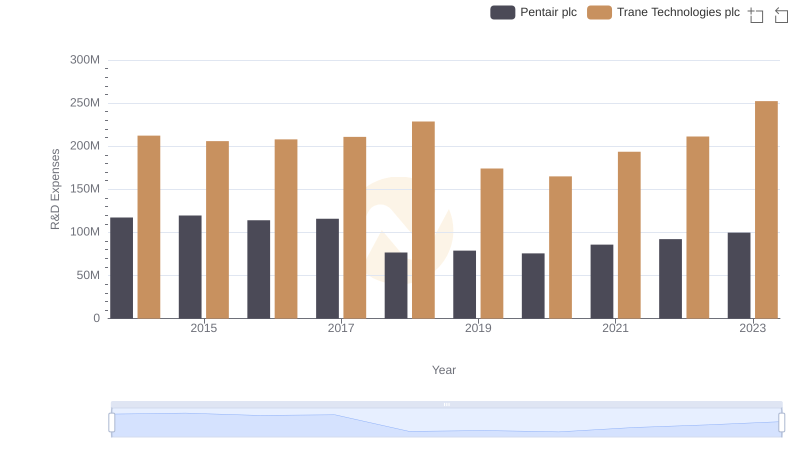
Research and Development: Comparing Key Metrics for Trane Technologies plc and Pentair plc
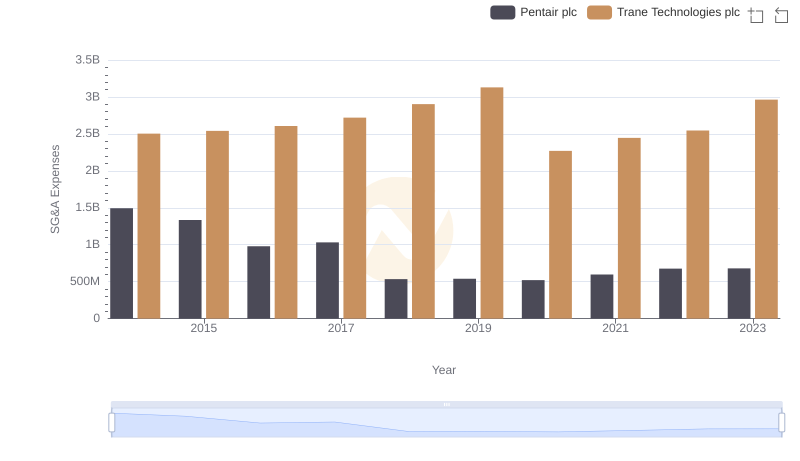
SG&A Efficiency Analysis: Comparing Trane Technologies plc and Pentair plc
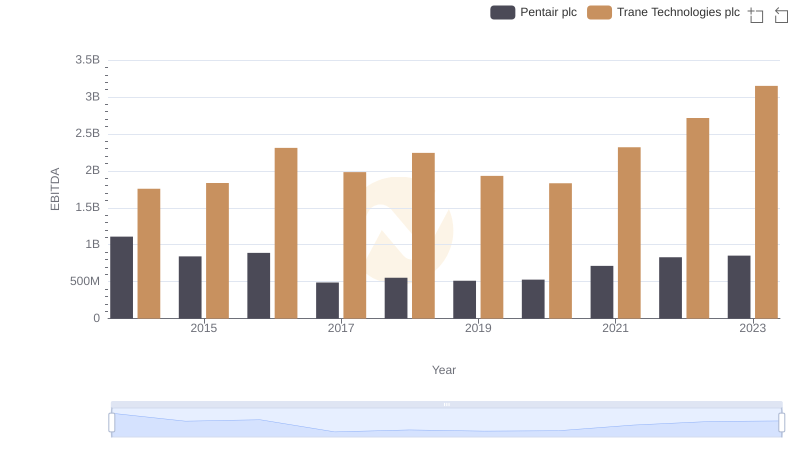
EBITDA Performance Review: Trane Technologies plc vs Pentair plc