| __timestamp | J.B. Hunt Transport Services, Inc. | Trane Technologies plc |
|---|---|---|
| Wednesday, January 1, 2014 | 5124095000 | 8982800000 |
| Thursday, January 1, 2015 | 5041472000 | 9301600000 |
| Friday, January 1, 2016 | 5369826000 | 9329300000 |
| Sunday, January 1, 2017 | 5990275000 | 9811600000 |
| Monday, January 1, 2018 | 7255657000 | 10847600000 |
| Tuesday, January 1, 2019 | 7659003000 | 11451500000 |
| Wednesday, January 1, 2020 | 8186697000 | 8651300000 |
| Friday, January 1, 2021 | 10298483000 | 9666800000 |
| Saturday, January 1, 2022 | 12341472000 | 11026900000 |
| Sunday, January 1, 2023 | 10433277000 | 11820400000 |
| Monday, January 1, 2024 | 12757700000 |
In pursuit of knowledge
In the ever-evolving landscape of corporate efficiency, understanding cost management is crucial. This analysis delves into the cost of revenue trends for Trane Technologies plc and J.B. Hunt Transport Services, Inc. from 2014 to 2023. Over this period, Trane Technologies consistently maintained a higher cost of revenue, peaking at approximately $11.8 billion in 2023. In contrast, J.B. Hunt's cost of revenue saw a significant rise, reaching its zenith at around $12.3 billion in 2022, marking a 140% increase from 2014.
The data reveals that while both companies experienced growth, J.B. Hunt's cost efficiency improved more dramatically, especially post-2018. This trend highlights the dynamic nature of operational strategies in the transportation and technology sectors. As businesses navigate economic shifts, these insights underscore the importance of strategic cost management in sustaining competitive advantage.
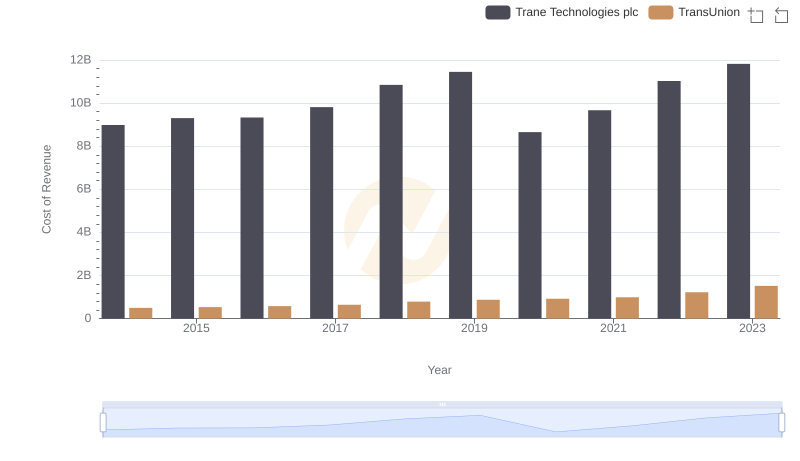
Cost of Revenue Comparison: Trane Technologies plc vs TransUnion
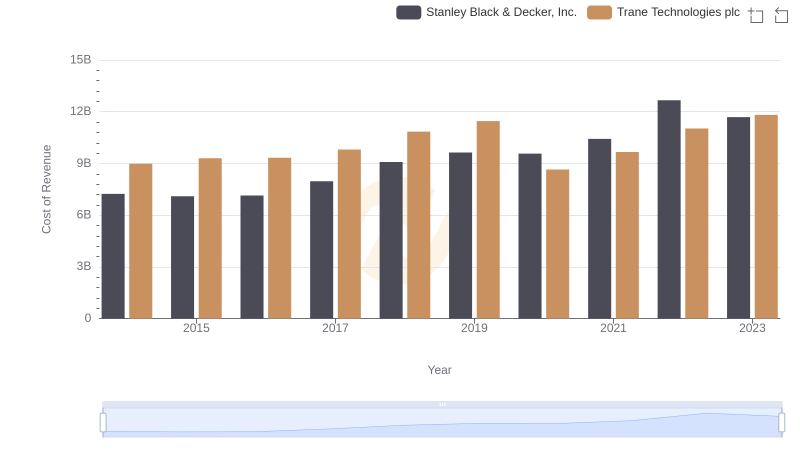
Cost of Revenue Trends: Trane Technologies plc vs Stanley Black & Decker, Inc.
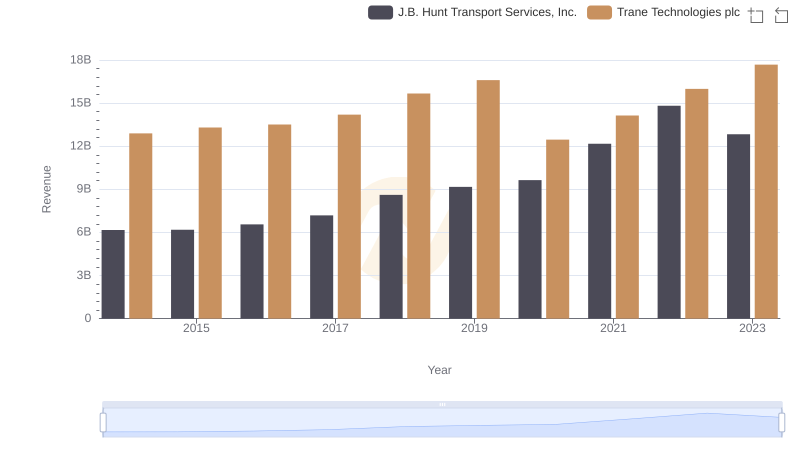
Trane Technologies plc vs J.B. Hunt Transport Services, Inc.: Examining Key Revenue Metrics
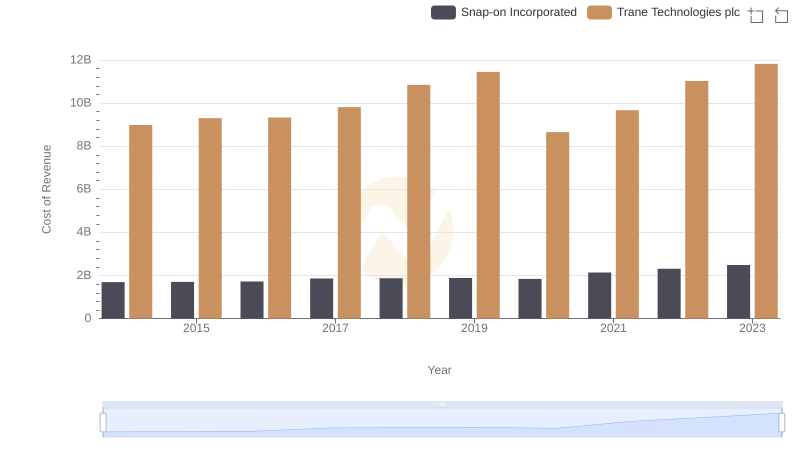
Cost Insights: Breaking Down Trane Technologies plc and Snap-on Incorporated's Expenses
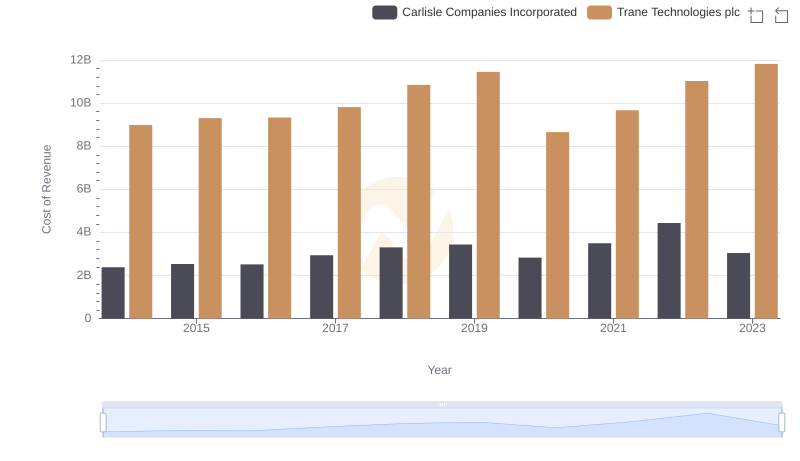
Comparing Cost of Revenue Efficiency: Trane Technologies plc vs Carlisle Companies Incorporated
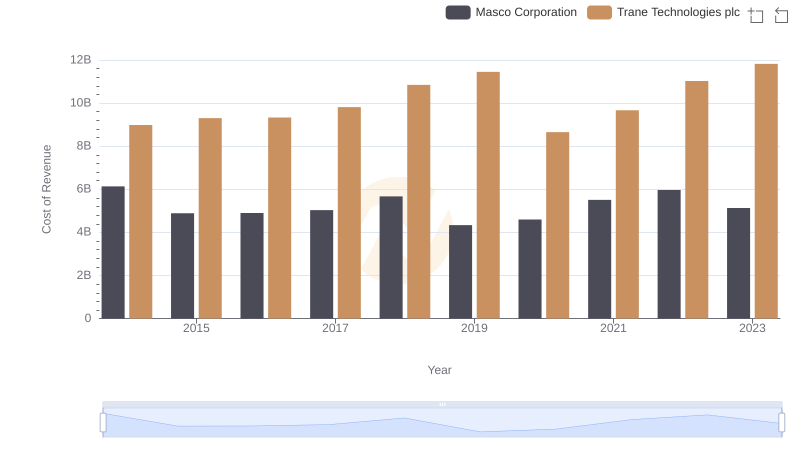
Cost of Revenue Trends: Trane Technologies plc vs Masco Corporation
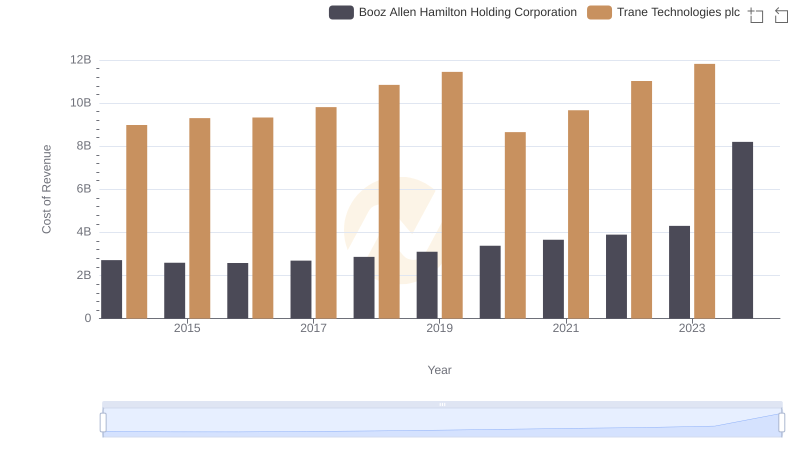
Cost of Revenue Trends: Trane Technologies plc vs Booz Allen Hamilton Holding Corporation
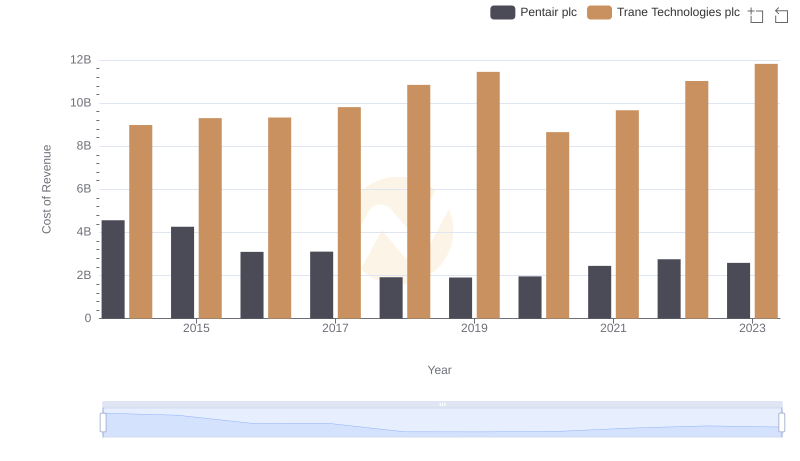
Analyzing Cost of Revenue: Trane Technologies plc and Pentair plc
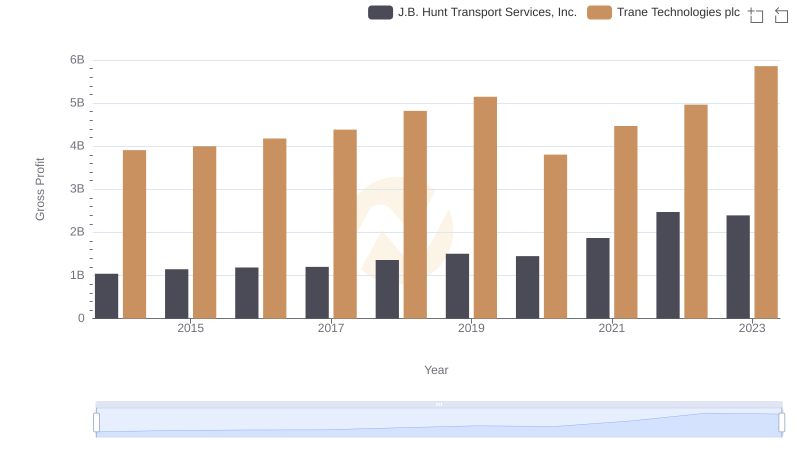
Gross Profit Comparison: Trane Technologies plc and J.B. Hunt Transport Services, Inc. Trends
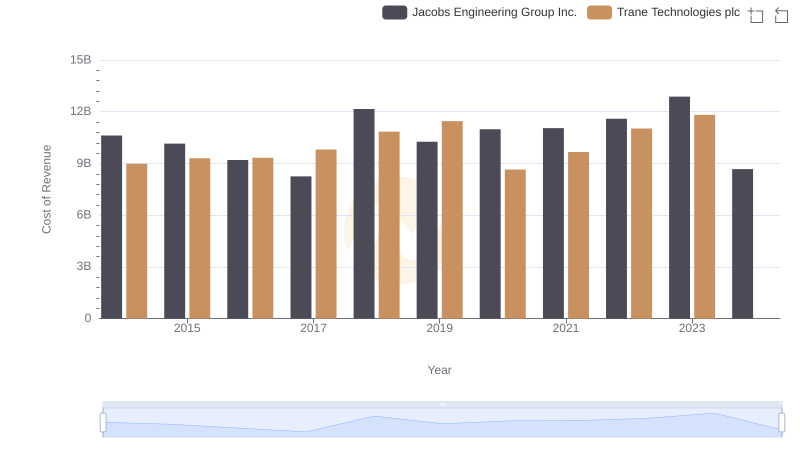
Comparing Cost of Revenue Efficiency: Trane Technologies plc vs Jacobs Engineering Group Inc.
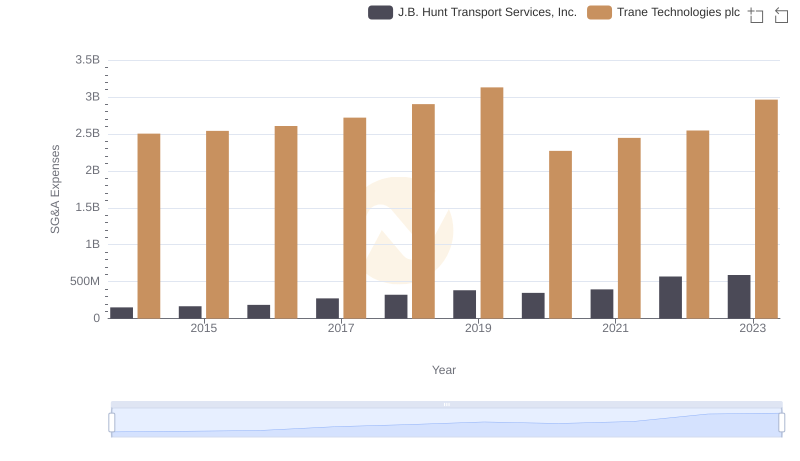
Trane Technologies plc or J.B. Hunt Transport Services, Inc.: Who Manages SG&A Costs Better?
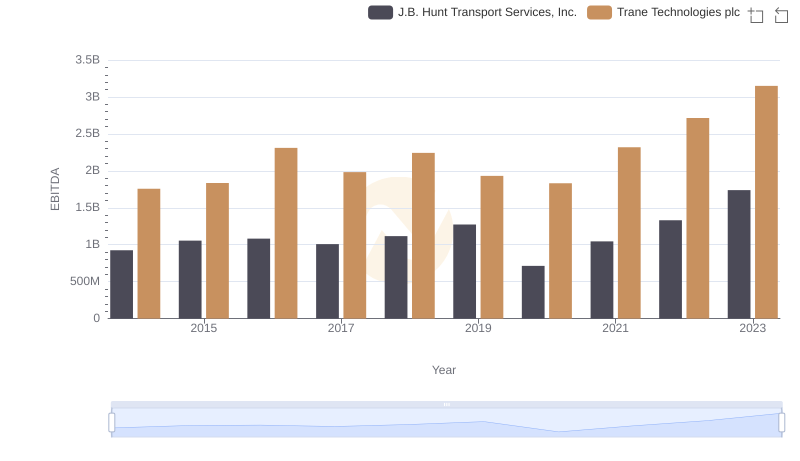
EBITDA Metrics Evaluated: Trane Technologies plc vs J.B. Hunt Transport Services, Inc.