| __timestamp | Masco Corporation | Trane Technologies plc |
|---|---|---|
| Wednesday, January 1, 2014 | 6134000000 | 8982800000 |
| Thursday, January 1, 2015 | 4889000000 | 9301600000 |
| Friday, January 1, 2016 | 4901000000 | 9329300000 |
| Sunday, January 1, 2017 | 5033000000 | 9811600000 |
| Monday, January 1, 2018 | 5670000000 | 10847600000 |
| Tuesday, January 1, 2019 | 4336000000 | 11451500000 |
| Wednesday, January 1, 2020 | 4601000000 | 8651300000 |
| Friday, January 1, 2021 | 5512000000 | 9666800000 |
| Saturday, January 1, 2022 | 5967000000 | 11026900000 |
| Sunday, January 1, 2023 | 5131000000 | 11820400000 |
| Monday, January 1, 2024 | 4997000000 | 12757700000 |
Unleashing insights
In the ever-evolving landscape of industrial giants, understanding cost dynamics is crucial. Trane Technologies plc and Masco Corporation, two stalwarts in their respective sectors, have shown intriguing trends in their cost of revenue from 2014 to 2023.
Trane Technologies has consistently outpaced Masco, with its cost of revenue peaking at approximately 11.8 billion in 2023, marking a 32% increase from 2014. This upward trajectory reflects Trane's robust growth and strategic investments. In contrast, Masco's cost of revenue has been more volatile, with a notable dip in 2019 to around 4.3 billion, before recovering to 5.1 billion in 2023.
These trends highlight the differing operational strategies and market conditions faced by these corporations. As we delve deeper into these financial narratives, the data underscores the importance of strategic cost management in maintaining competitive advantage.
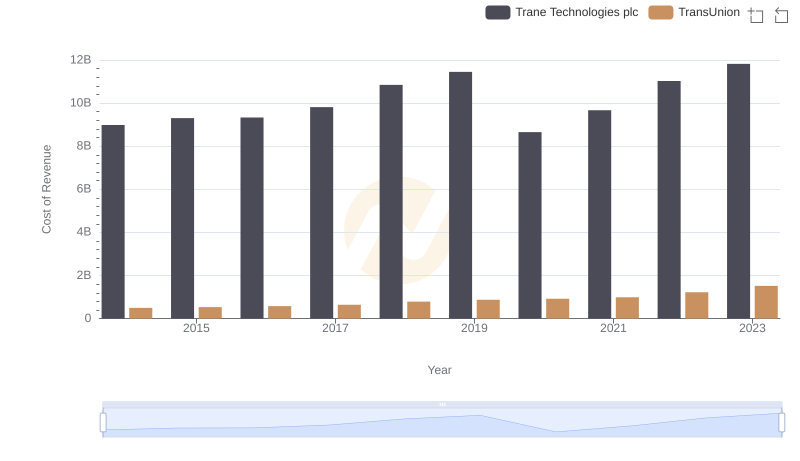
Cost of Revenue Comparison: Trane Technologies plc vs TransUnion
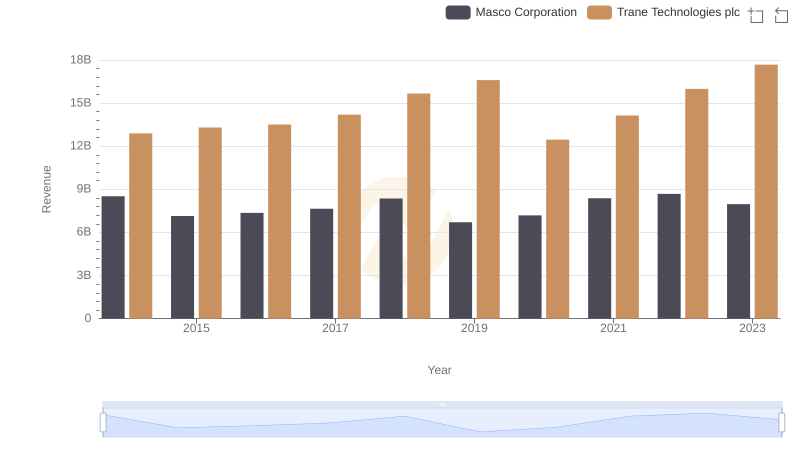
Revenue Showdown: Trane Technologies plc vs Masco Corporation
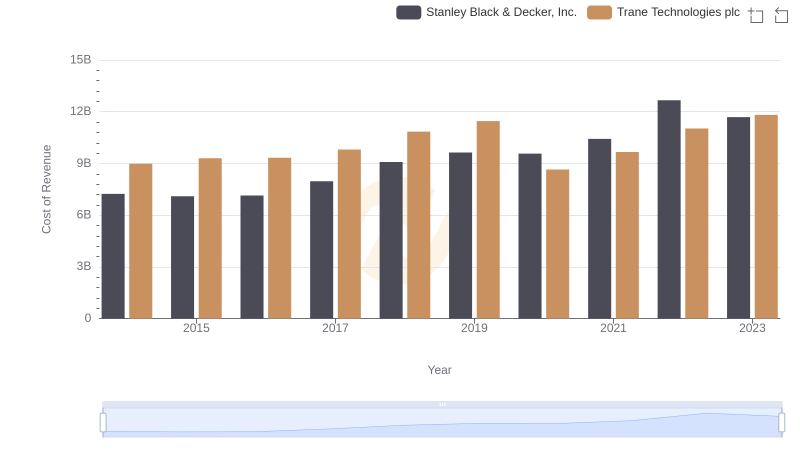
Cost of Revenue Trends: Trane Technologies plc vs Stanley Black & Decker, Inc.
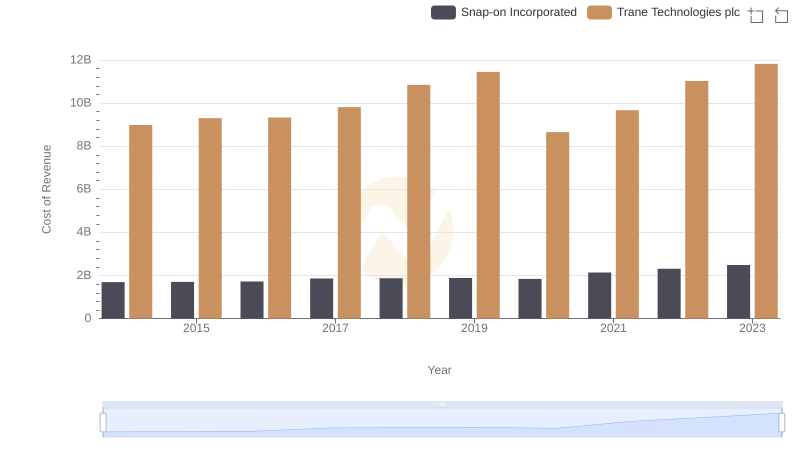
Cost Insights: Breaking Down Trane Technologies plc and Snap-on Incorporated's Expenses
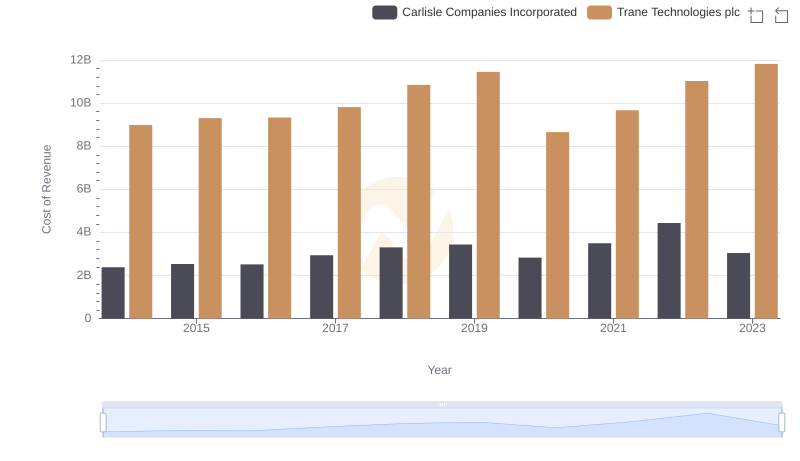
Comparing Cost of Revenue Efficiency: Trane Technologies plc vs Carlisle Companies Incorporated
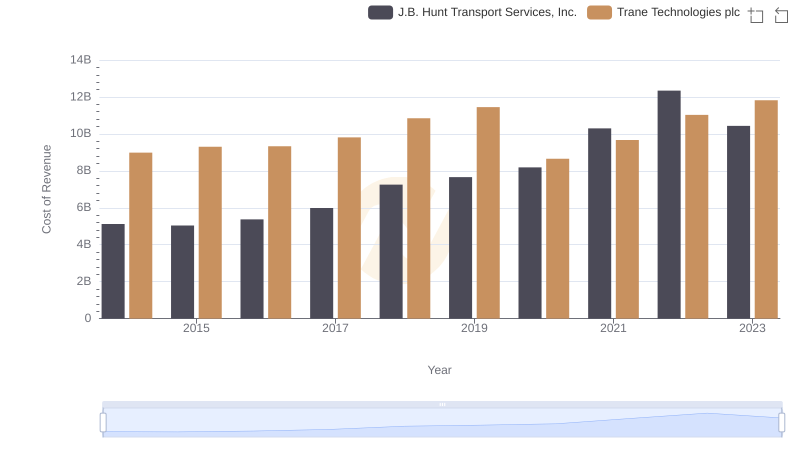
Trane Technologies plc vs J.B. Hunt Transport Services, Inc.: Efficiency in Cost of Revenue Explored
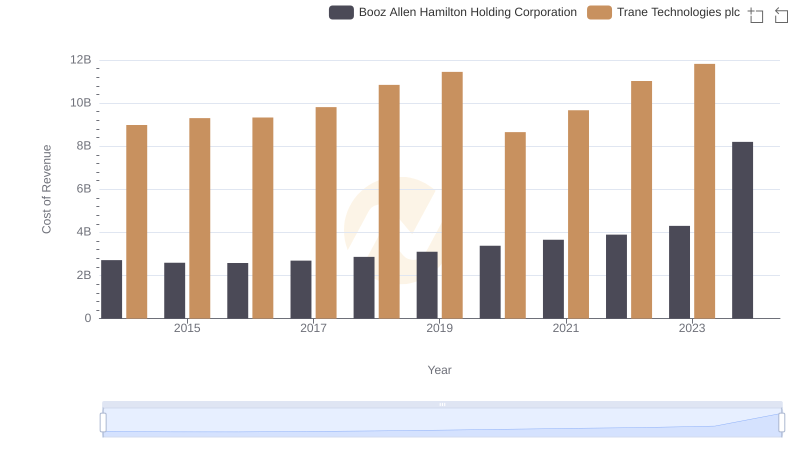
Cost of Revenue Trends: Trane Technologies plc vs Booz Allen Hamilton Holding Corporation
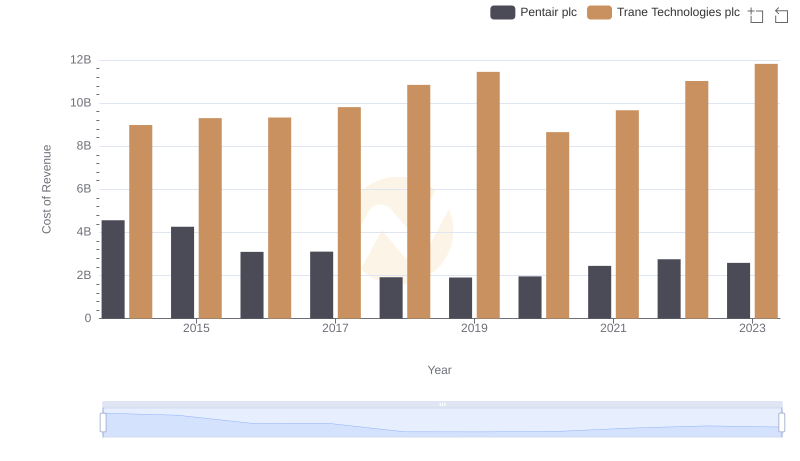
Analyzing Cost of Revenue: Trane Technologies plc and Pentair plc
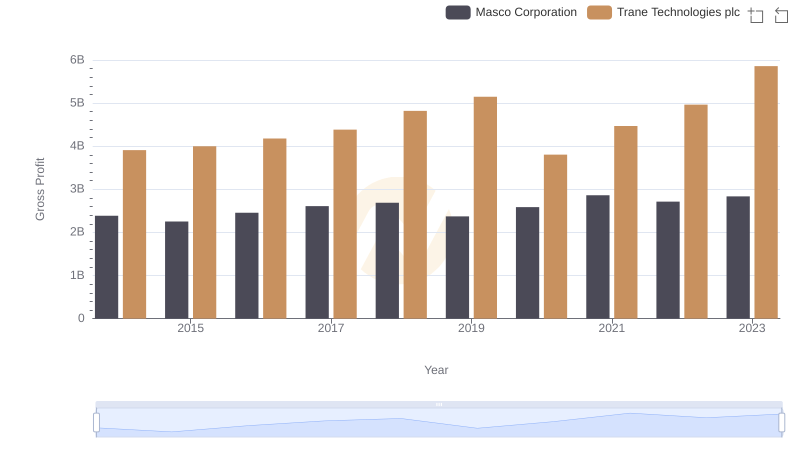
Trane Technologies plc vs Masco Corporation: A Gross Profit Performance Breakdown
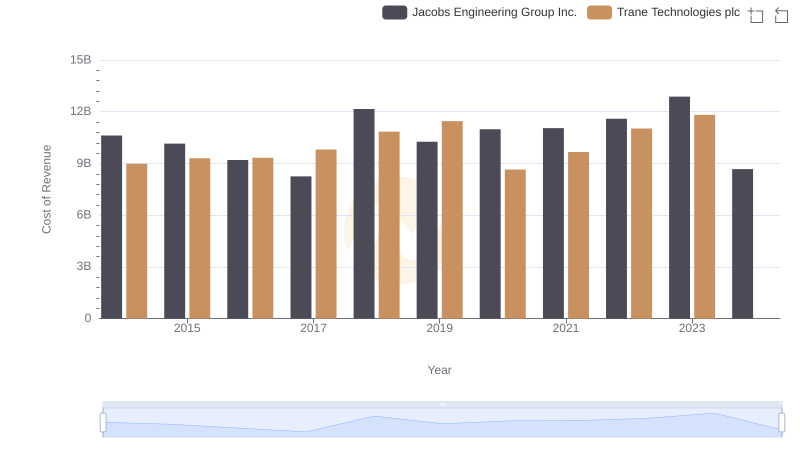
Comparing Cost of Revenue Efficiency: Trane Technologies plc vs Jacobs Engineering Group Inc.
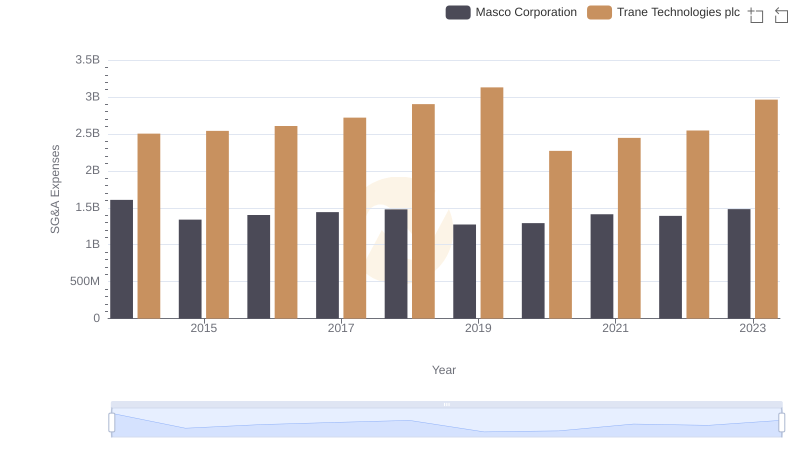
Operational Costs Compared: SG&A Analysis of Trane Technologies plc and Masco Corporation