| __timestamp | Jacobs Engineering Group Inc. | Trane Technologies plc |
|---|---|---|
| Wednesday, January 1, 2014 | 10621373000 | 8982800000 |
| Thursday, January 1, 2015 | 10146494000 | 9301600000 |
| Friday, January 1, 2016 | 9196326000 | 9329300000 |
| Sunday, January 1, 2017 | 8250536000 | 9811600000 |
| Monday, January 1, 2018 | 12156276000 | 10847600000 |
| Tuesday, January 1, 2019 | 10260840000 | 11451500000 |
| Wednesday, January 1, 2020 | 10980307000 | 8651300000 |
| Friday, January 1, 2021 | 11048860000 | 9666800000 |
| Saturday, January 1, 2022 | 11595785000 | 11026900000 |
| Sunday, January 1, 2023 | 12879099000 | 11820400000 |
| Monday, January 1, 2024 | 8668185000 | 12757700000 |
Infusing magic into the data realm
In the competitive landscape of industrial giants, understanding cost efficiency is crucial. Trane Technologies plc and Jacobs Engineering Group Inc. have been pivotal players in this arena. From 2014 to 2023, Jacobs Engineering consistently maintained a higher cost of revenue, peaking in 2023 with a 22% increase from its 2014 figures. Meanwhile, Trane Technologies showed a steady rise, with a notable 31% increase in 2023 compared to 2014. However, 2024 data for Trane Technologies is missing, leaving a gap in the analysis. This trend highlights Jacobs Engineering's robust cost management strategies, while Trane Technologies demonstrates significant growth potential. As these companies navigate the evolving market, their cost efficiency will remain a key indicator of their financial health and competitive edge.
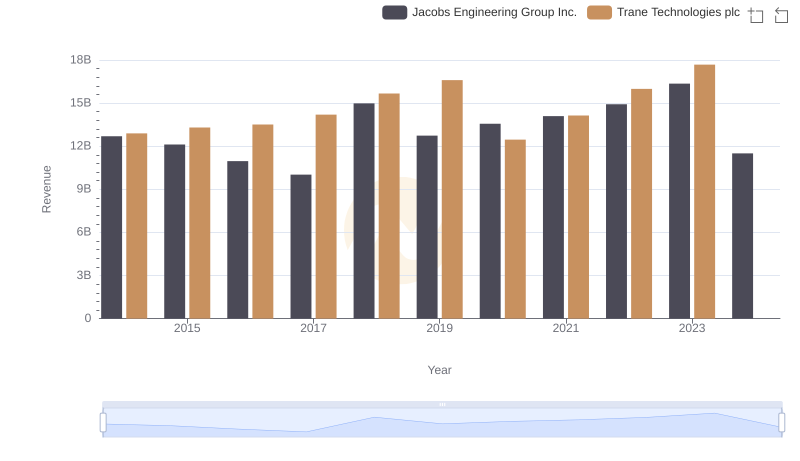
Annual Revenue Comparison: Trane Technologies plc vs Jacobs Engineering Group Inc.
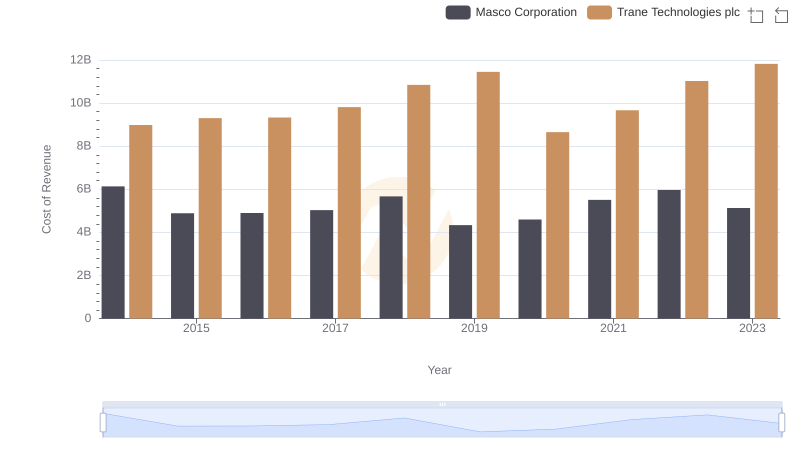
Cost of Revenue Trends: Trane Technologies plc vs Masco Corporation
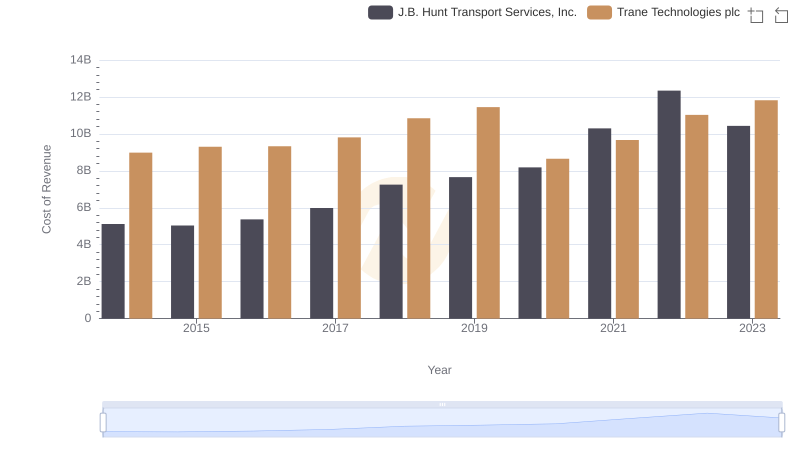
Trane Technologies plc vs J.B. Hunt Transport Services, Inc.: Efficiency in Cost of Revenue Explored
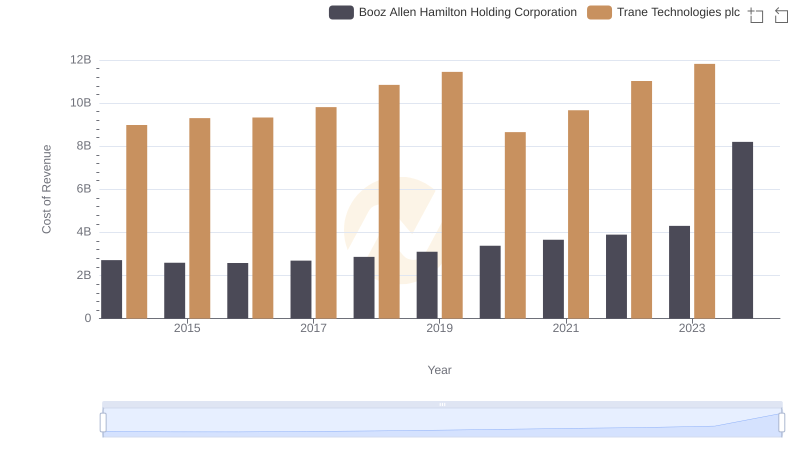
Cost of Revenue Trends: Trane Technologies plc vs Booz Allen Hamilton Holding Corporation
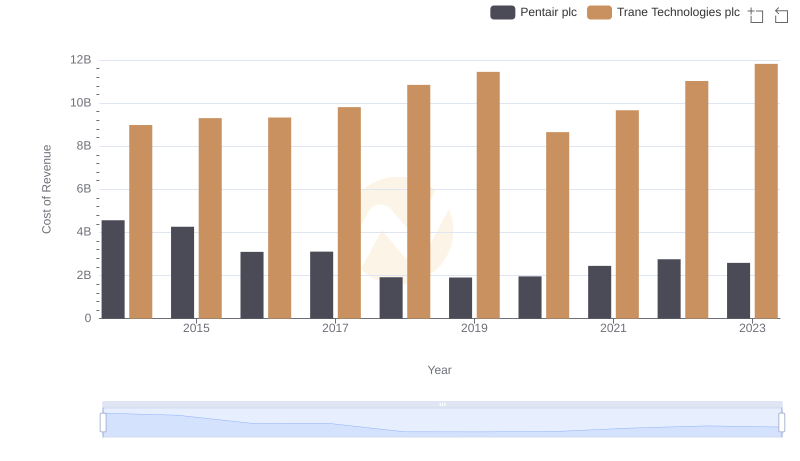
Analyzing Cost of Revenue: Trane Technologies plc and Pentair plc
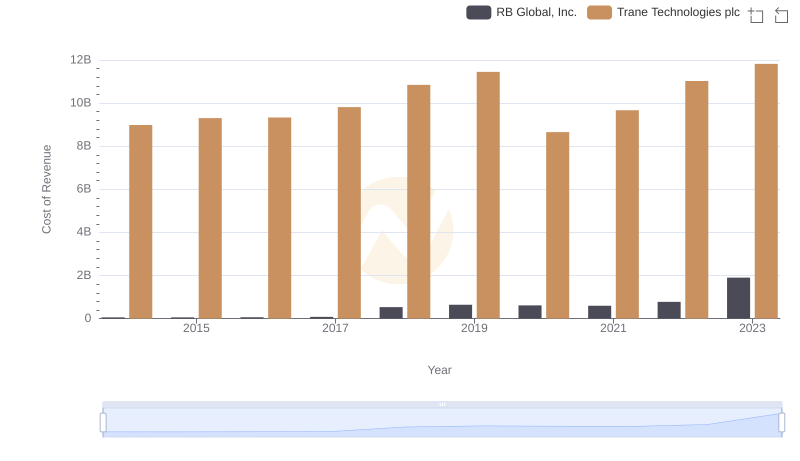
Cost Insights: Breaking Down Trane Technologies plc and RB Global, Inc.'s Expenses

Comparing Cost of Revenue Efficiency: Trane Technologies plc vs IDEX Corporation
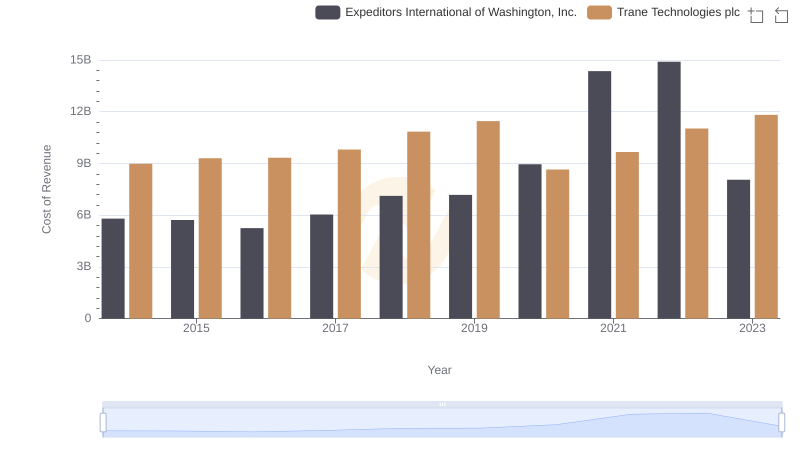
Analyzing Cost of Revenue: Trane Technologies plc and Expeditors International of Washington, Inc.
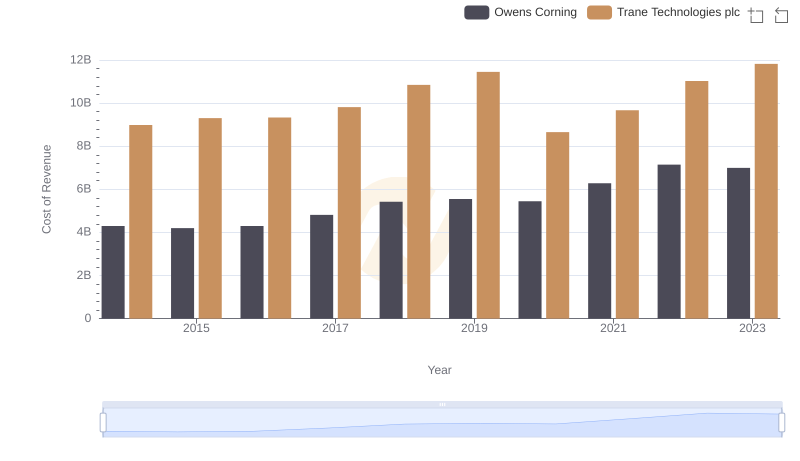
Cost Insights: Breaking Down Trane Technologies plc and Owens Corning's Expenses
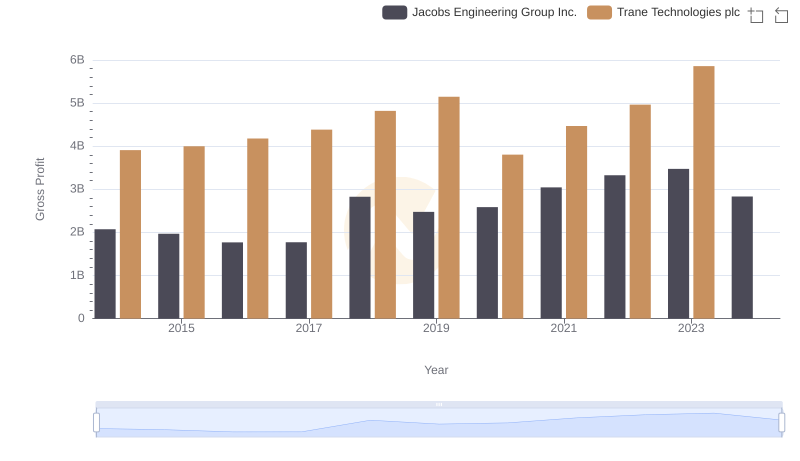
Who Generates Higher Gross Profit? Trane Technologies plc or Jacobs Engineering Group Inc.
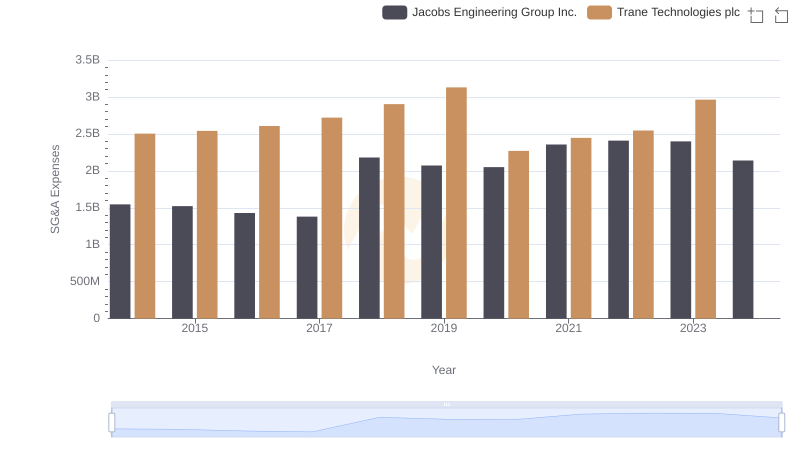
Breaking Down SG&A Expenses: Trane Technologies plc vs Jacobs Engineering Group Inc.
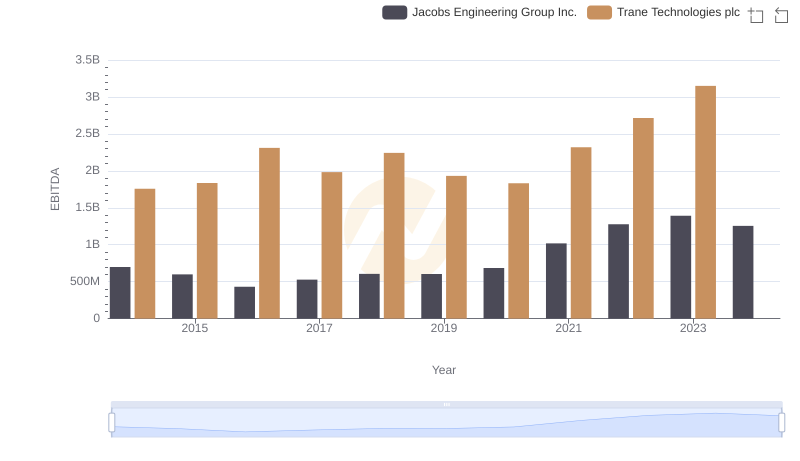
EBITDA Analysis: Evaluating Trane Technologies plc Against Jacobs Engineering Group Inc.