| __timestamp | Booz Allen Hamilton Holding Corporation | Trane Technologies plc |
|---|---|---|
| Wednesday, January 1, 2014 | 2229642000 | 2503900000 |
| Thursday, January 1, 2015 | 2159439000 | 2541100000 |
| Friday, January 1, 2016 | 2319592000 | 2606500000 |
| Sunday, January 1, 2017 | 2568511000 | 2720700000 |
| Monday, January 1, 2018 | 2719909000 | 2903200000 |
| Tuesday, January 1, 2019 | 2932602000 | 3129800000 |
| Wednesday, January 1, 2020 | 3334378000 | 2270600000 |
| Friday, January 1, 2021 | 3362722000 | 2446300000 |
| Saturday, January 1, 2022 | 3633150000 | 2545900000 |
| Sunday, January 1, 2023 | 4341769000 | 2963200000 |
| Monday, January 1, 2024 | 1281443000 | 3580400000 |
Unleashing the power of data
In the ever-evolving landscape of corporate finance, understanding the spending patterns of industry giants is crucial. Trane Technologies plc and Booz Allen Hamilton Holding Corporation, two stalwarts in their respective fields, have shown distinct trends in their Selling, General, and Administrative (SG&A) expenses over the past decade. From 2014 to 2023, Booz Allen Hamilton's SG&A expenses surged by approximately 95%, peaking in 2023. In contrast, Trane Technologies experienced a more modest increase of around 18% over the same period, with a notable dip in 2020. This divergence highlights Booz Allen Hamilton's aggressive expansion strategy, while Trane Technologies appears to focus on efficiency and cost management. The data for 2024 is incomplete, leaving room for speculation on future trends. As businesses navigate the complexities of the modern economy, these insights offer a glimpse into strategic financial planning.
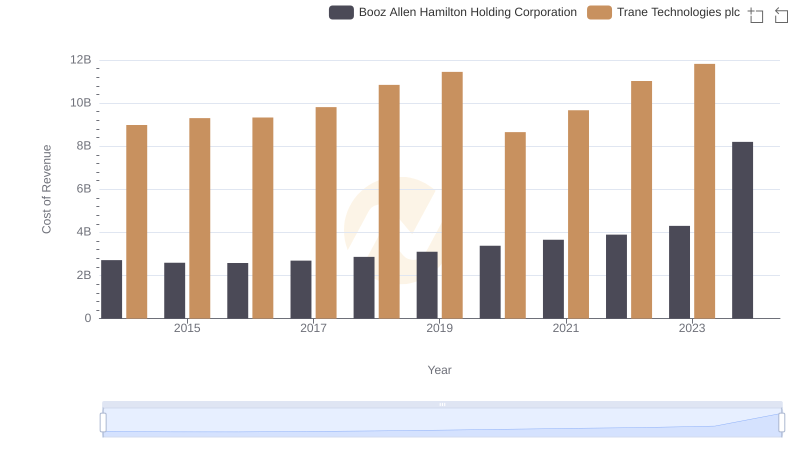
Cost of Revenue Trends: Trane Technologies plc vs Booz Allen Hamilton Holding Corporation
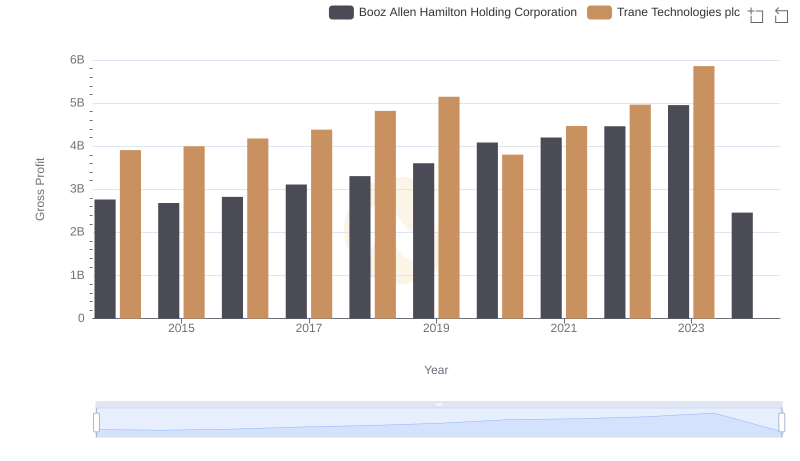
Key Insights on Gross Profit: Trane Technologies plc vs Booz Allen Hamilton Holding Corporation
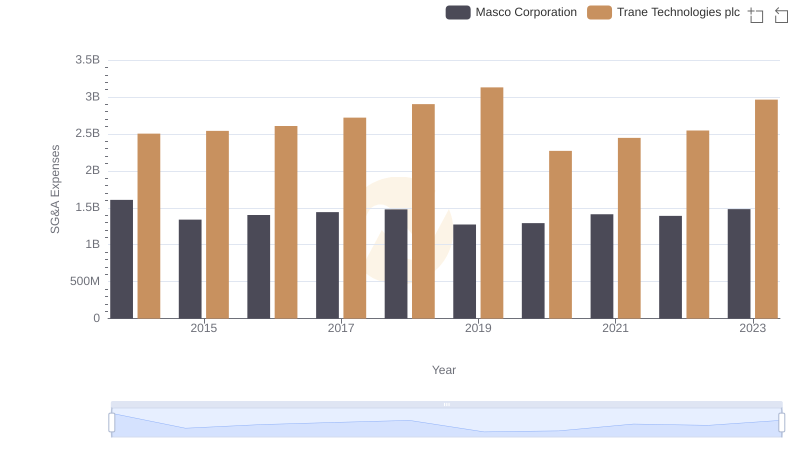
Operational Costs Compared: SG&A Analysis of Trane Technologies plc and Masco Corporation
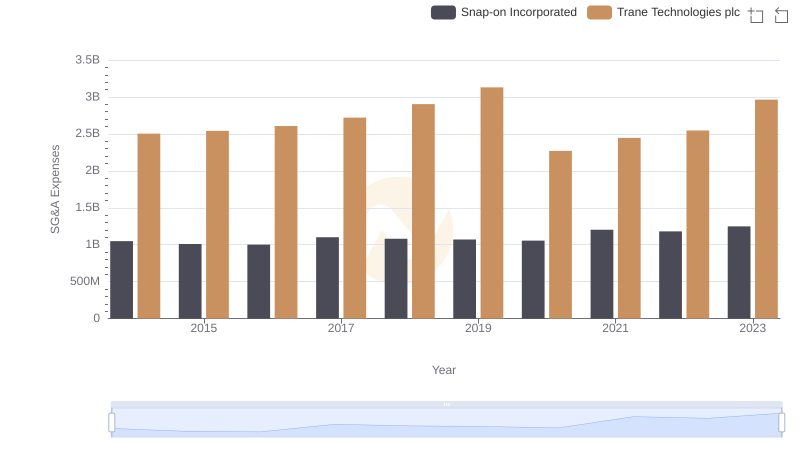
Breaking Down SG&A Expenses: Trane Technologies plc vs Snap-on Incorporated
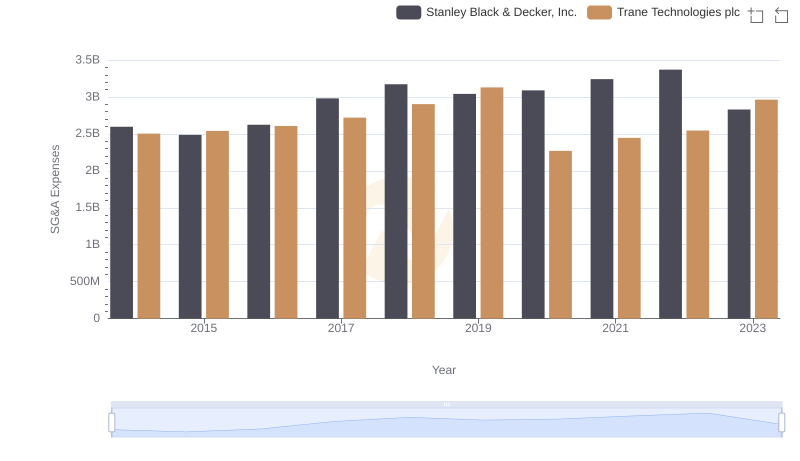
Trane Technologies plc and Stanley Black & Decker, Inc.: SG&A Spending Patterns Compared
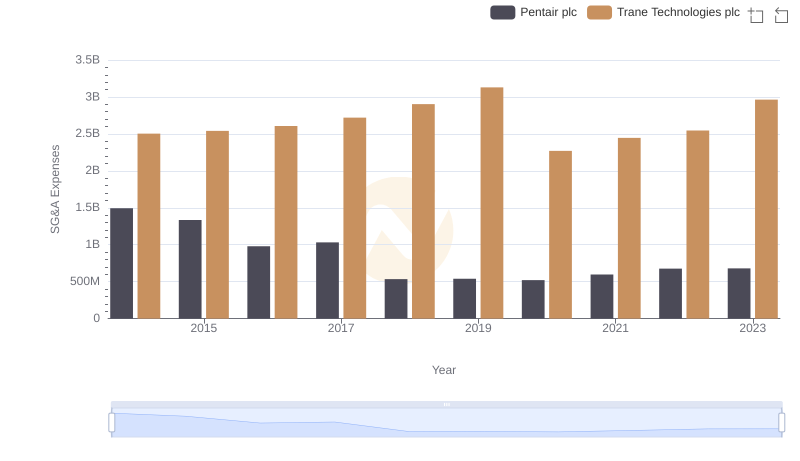
SG&A Efficiency Analysis: Comparing Trane Technologies plc and Pentair plc
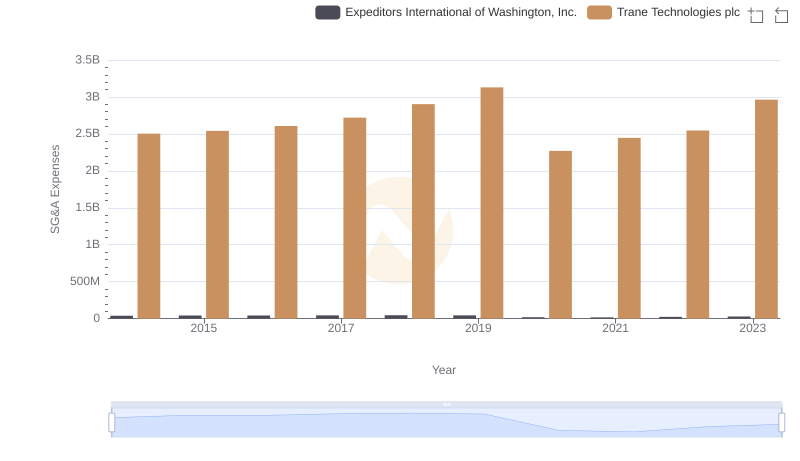
Breaking Down SG&A Expenses: Trane Technologies plc vs Expeditors International of Washington, Inc.
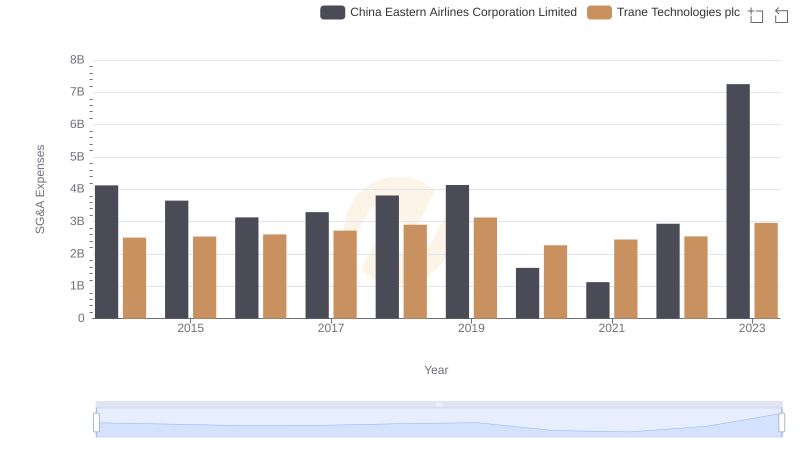
Comparing SG&A Expenses: Trane Technologies plc vs China Eastern Airlines Corporation Limited Trends and Insights

Professional EBITDA Benchmarking: Trane Technologies plc vs Booz Allen Hamilton Holding Corporation