| __timestamp | RB Global, Inc. | Trane Technologies plc |
|---|---|---|
| Wednesday, January 1, 2014 | 57884000 | 8982800000 |
| Thursday, January 1, 2015 | 56026000 | 9301600000 |
| Friday, January 1, 2016 | 66062000 | 9329300000 |
| Sunday, January 1, 2017 | 79013000 | 9811600000 |
| Monday, January 1, 2018 | 533397000 | 10847600000 |
| Tuesday, January 1, 2019 | 645816000 | 11451500000 |
| Wednesday, January 1, 2020 | 615589000 | 8651300000 |
| Friday, January 1, 2021 | 594783000 | 9666800000 |
| Saturday, January 1, 2022 | 776701000 | 11026900000 |
| Sunday, January 1, 2023 | 1901200000 | 11820400000 |
| Monday, January 1, 2024 | 0 | 12757700000 |
Data in motion
In the ever-evolving landscape of industrial giants, understanding cost structures is pivotal. Trane Technologies plc and RB Global, Inc. have showcased intriguing trends in their cost of revenue from 2014 to 2023. Trane Technologies, a leader in climate solutions, consistently maintained a higher cost of revenue, peaking at approximately $11.8 billion in 2023. This represents a 32% increase from 2014, reflecting their expansive growth and innovation strategies.
Conversely, RB Global, Inc., a key player in the auction and asset management sector, experienced a dramatic surge in 2023, with costs soaring to $1.9 billion, a staggering 3,200% increase from 2014. This spike underscores their aggressive market expansion and strategic acquisitions. These insights reveal the contrasting financial narratives of two industry titans, offering a window into their operational priorities and market positioning.
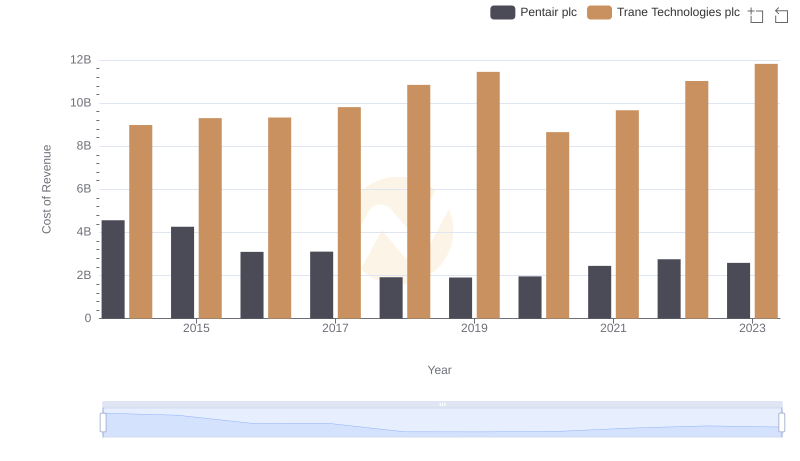
Analyzing Cost of Revenue: Trane Technologies plc and Pentair plc
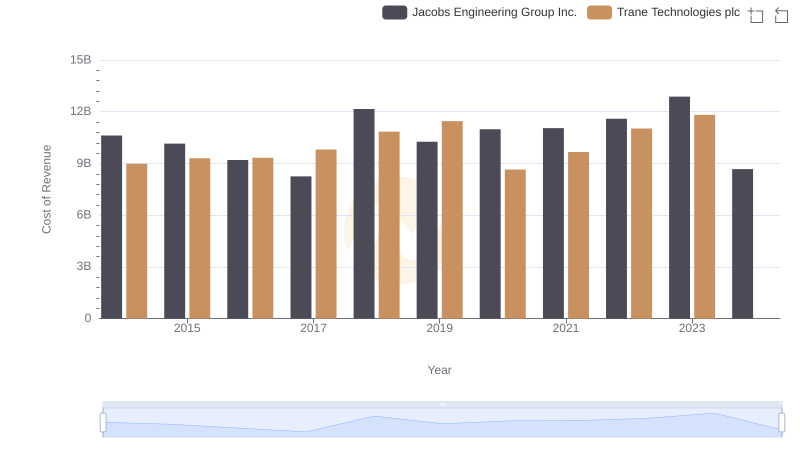
Comparing Cost of Revenue Efficiency: Trane Technologies plc vs Jacobs Engineering Group Inc.

Comparing Cost of Revenue Efficiency: Trane Technologies plc vs IDEX Corporation
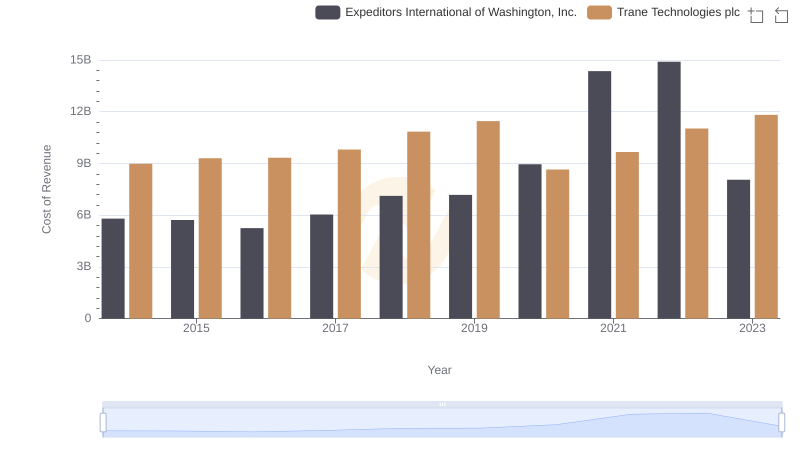
Analyzing Cost of Revenue: Trane Technologies plc and Expeditors International of Washington, Inc.
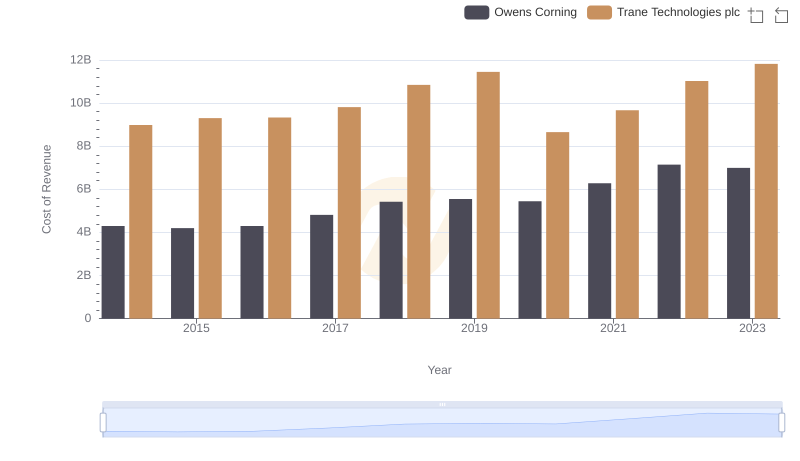
Cost Insights: Breaking Down Trane Technologies plc and Owens Corning's Expenses
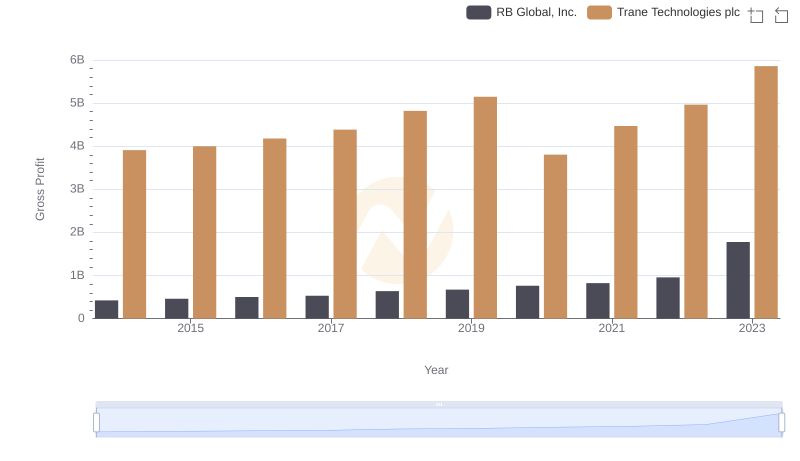
Who Generates Higher Gross Profit? Trane Technologies plc or RB Global, Inc.
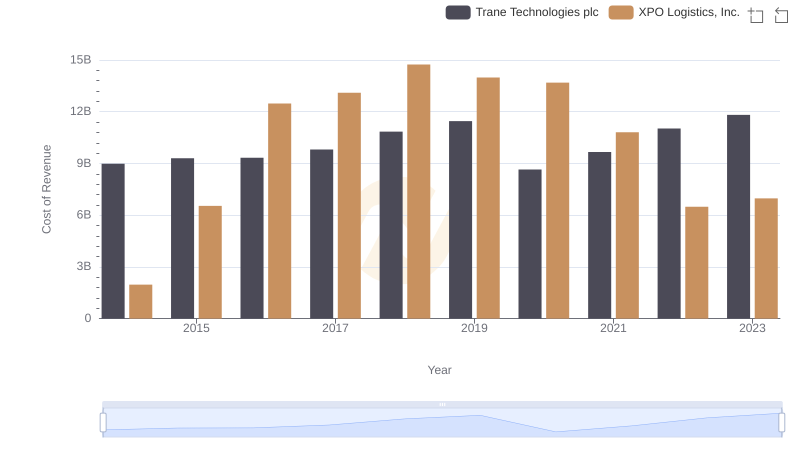
Cost of Revenue Trends: Trane Technologies plc vs XPO Logistics, Inc.
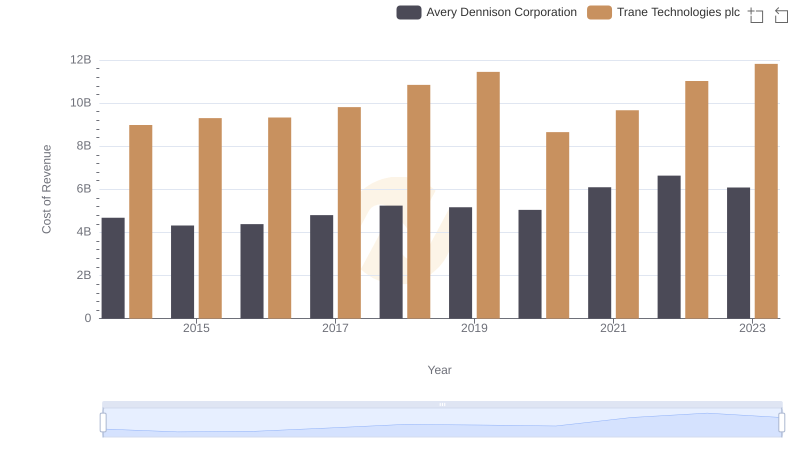
Comparing Cost of Revenue Efficiency: Trane Technologies plc vs Avery Dennison Corporation
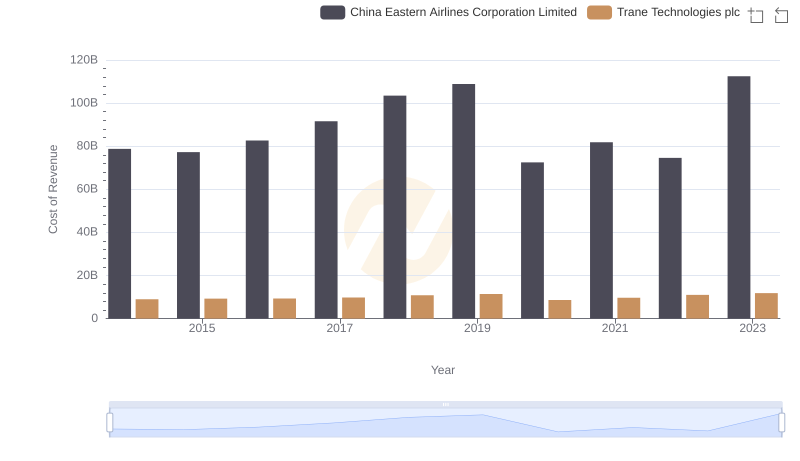
Cost Insights: Breaking Down Trane Technologies plc and China Eastern Airlines Corporation Limited's Expenses
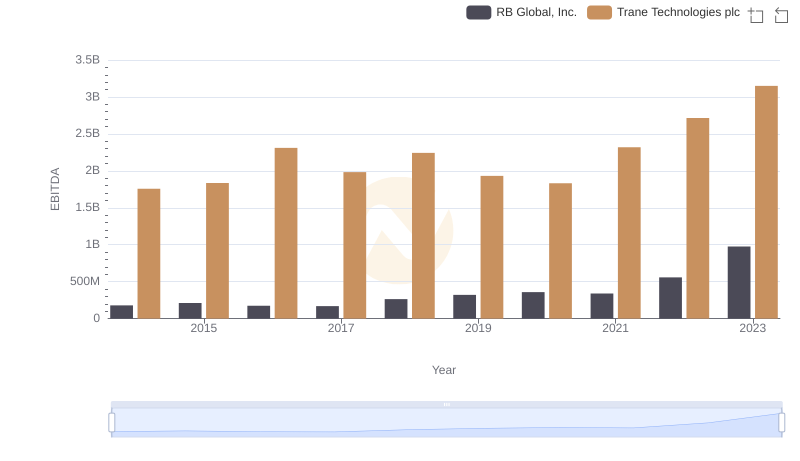
Comprehensive EBITDA Comparison: Trane Technologies plc vs RB Global, Inc.